Pollution
Up-to-date (last 2–4 weeks running average) global 6-gas monitoring — NO₂, SO₂, CO, CH₄, HCHO and aerosols — at 1.4km faithful machine learning projection, absolute and year-on-year.
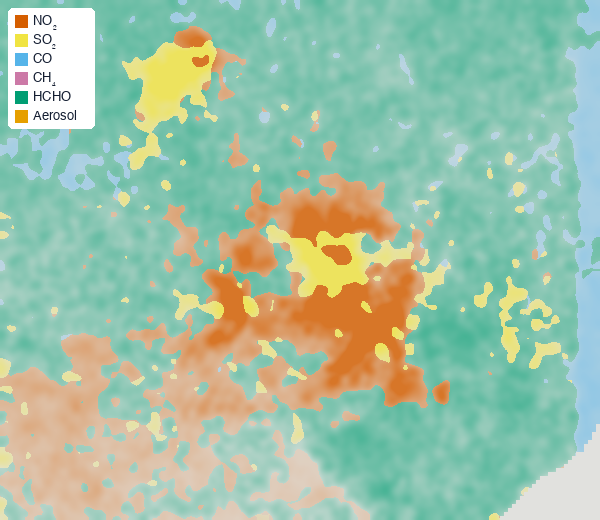
Satellite air-quality data has a unique set of uses, including:
- NO₂ tracking for air quality and industrial output (Sentinel-5P)
- Large methane super-emitters (oil and gas, coal mines, big landfills)
- SO₂ from volcanoes and smelters
- Aerosols, dust storms and wildfire smoke
- ESG and regulatory compliance verification
Worldwide pollution imagery is based on ESA Sentinel-5P and is available as:
- 1.4km faithful machine learning projection
- Up to date (last 2-4 weeks running average)
- Absolute value
- Relative to same period last year
Gases monitored are:
| Gas | Bands | Wavelength (nm) | Enhanced resolution (x4) | Source resolution |
|---|---|---|---|---|
| Aerosol (UV aerosol index) | 3 | 354, 388 | 1.4 × 0.9km | 5.5 × 3.5km |
| SO₂ (sulfur dioxide) | 3 | 310–326 | 1.4 × 0.9km | 5.5 × 3.5km |
| HCHO (formaldehyde) | 3 | 328–359 | 1.4 × 0.9km | 5.5 × 3.5km |
| NO₂ (nitrogen dioxide) | 4 | 405–465 | 1.4 × 0.9km | 5.5 × 3.5km |
| CO (carbon monoxide) | 7, 8 | 2305–2385 | 1.4 × 1.75km | 5.5 × 7km |
| CH₄ (methane) | 6, 7, 8 | 757–774, 2305–2385 | 1.4 × 1.75km | 5.5 × 7km |
What you receive
2–4 week running-average trace-gas layers (absolute and year-on-year change) for your region