Field Anomaly Detection
Universal early-warning signal for cropland
Fields are monitored episodically at best — a site visit, a drone flight, a manual inspection. By the time a problem is visible to the eye it has already cost weeks of crop loss or water waste. The challenge is catching the signal before it becomes a symptom.
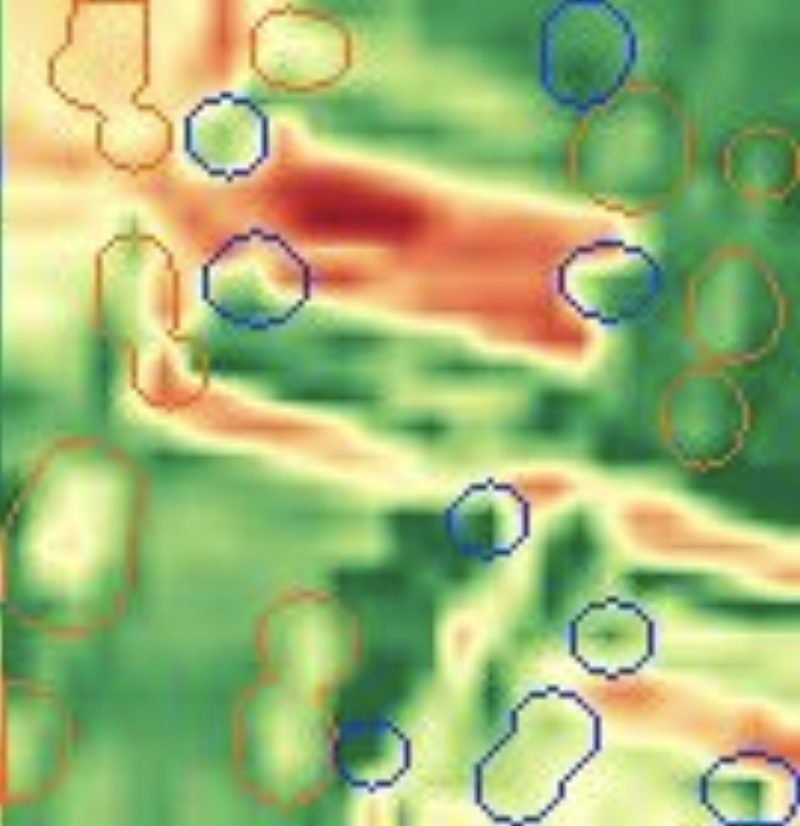
EarthToDate's Field Anomaly Detection flags locations where vegetation behaviour diverges, unexpectedly and significantly, from the surrounding local trend between two cloud-free observations. Within a coherent field, vegetation should respond similarly to the same conditions; a small patch that greens or declines against its neighbours is a signal worth investigating.
Detection runs at 2m using NDVI from enhanced multispectral, identifying anomalies at the 4×4m patch level — one twenty-fifth of a native Sentinel-2 pixel. Thresholds are derived automatically per field, season, and image pair, so no manual calibration is required. A disease focus of three or four plants, a first-week weed patch, or a single failed irrigation emitter becomes detectable at the moment it begins.
The same mechanism surfaces nutrient deficiency, pest and disease onset, waterlogging and drought stress, and even pipeline leaks or contamination along corridors. Results are delivered as georeferenced points or polygons with magnitude, direction, and persistence — ready for any GIS or agronomic platform.
Frequently asked questions
What is Field Anomaly Detection?
Fields are monitored episodically at best — a site visit, a drone flight, a manual inspection. By the time a problem is visible to the eye it has already cost weeks of crop loss or water waste. The challenge is catching the signal before it becomes a symptom.
What data and resolution does Field Anomaly Detection use?
Catches divergence at 4×4m — disease, pests, weeds, irrigation faults — weeks before it's visible at field scale. (Universal early-warning signal for cropland)
How does Field Anomaly Detection compare to the alternatives?
EarthToDate's Field Anomaly Detection flags locations where vegetation behaviour diverges, unexpectedly and significantly, from the surrounding local trend between two cloud-free observations. Within a coherent field, vegetation should respond similarly to the same conditions; a small patch that greens or declines against its neighbours is a signal worth investigating.
Where and how often is it available?
The same mechanism surfaces nutrient deficiency, pest and disease onset, waterlogging and drought stress, and even pipeline leaks or contamination along corridors. Results are delivered as georeferenced points or polygons with magnitude, direction, and persistence — ready for any GIS or agronomic platform.