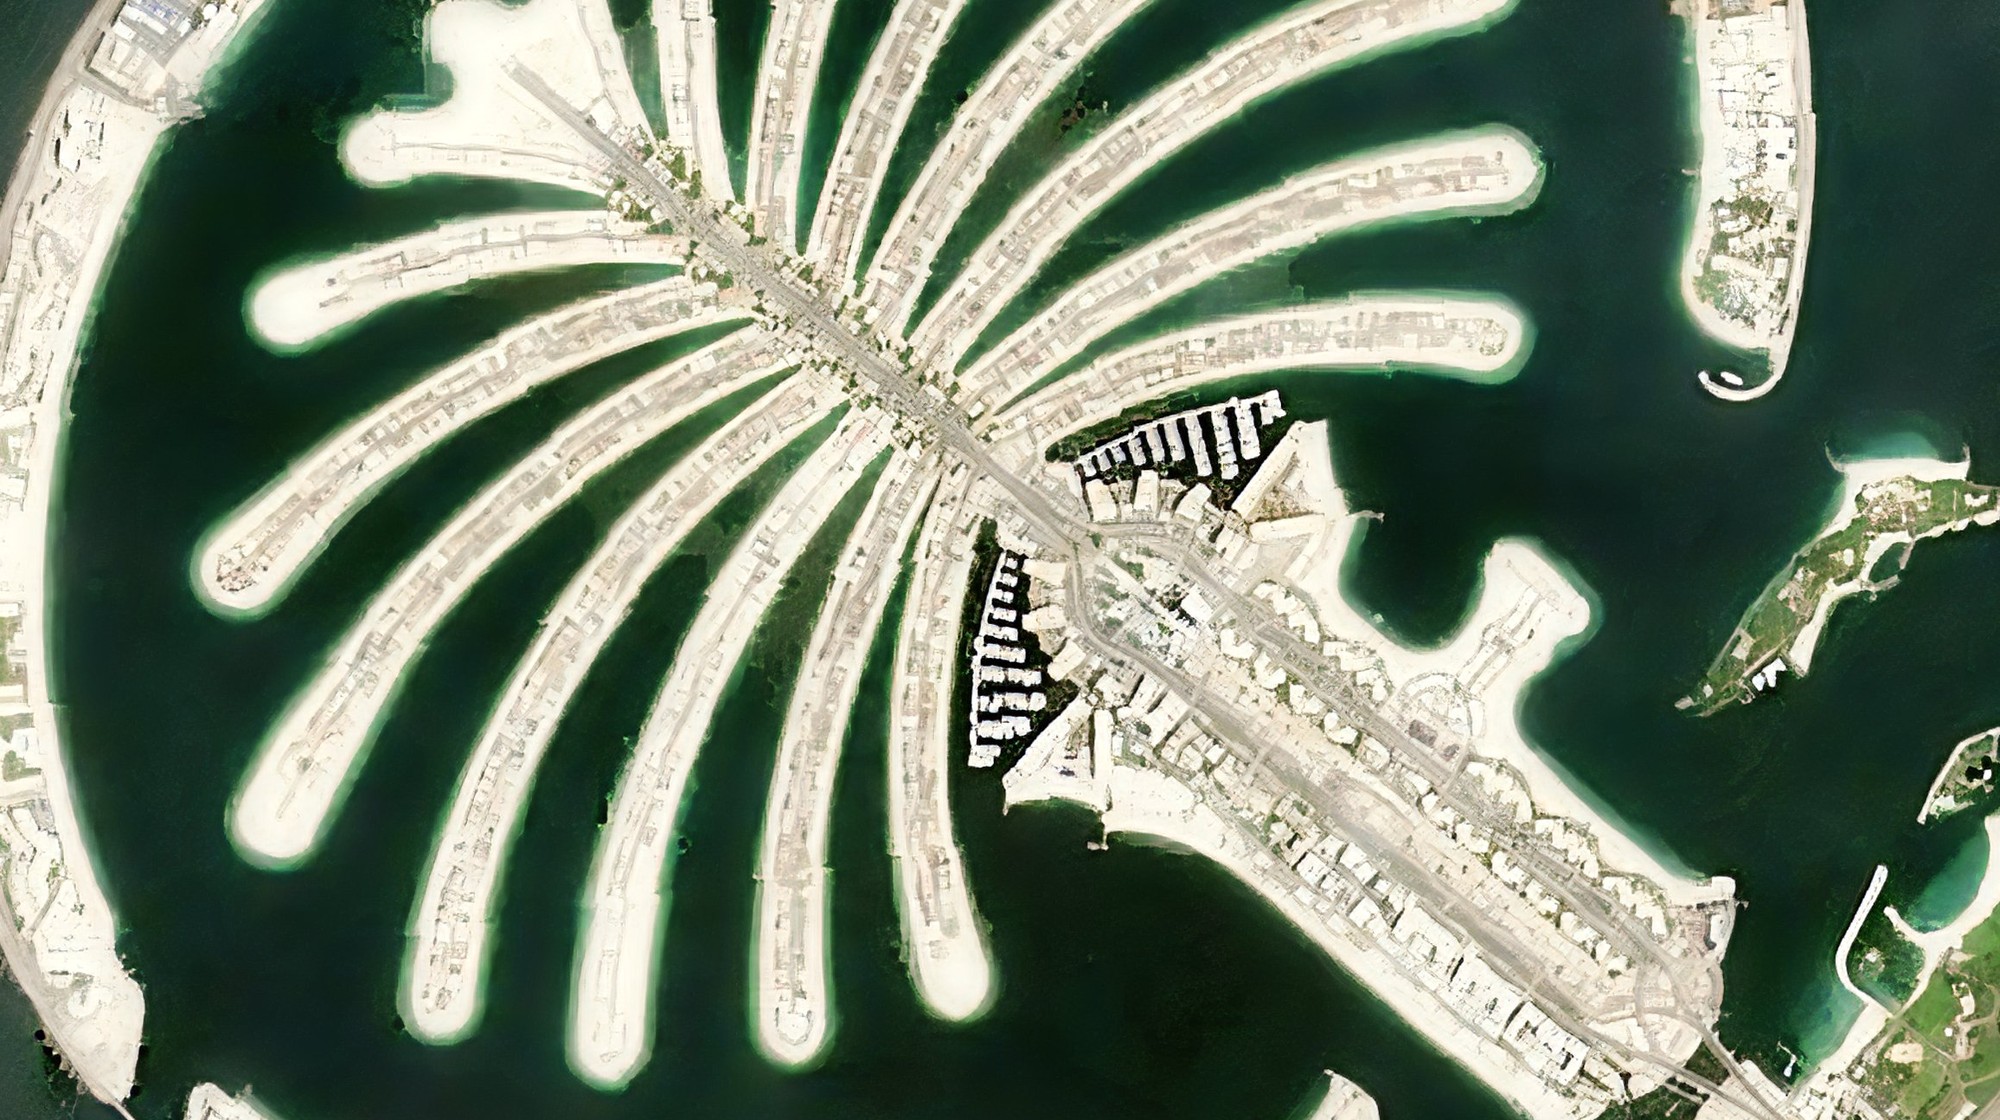
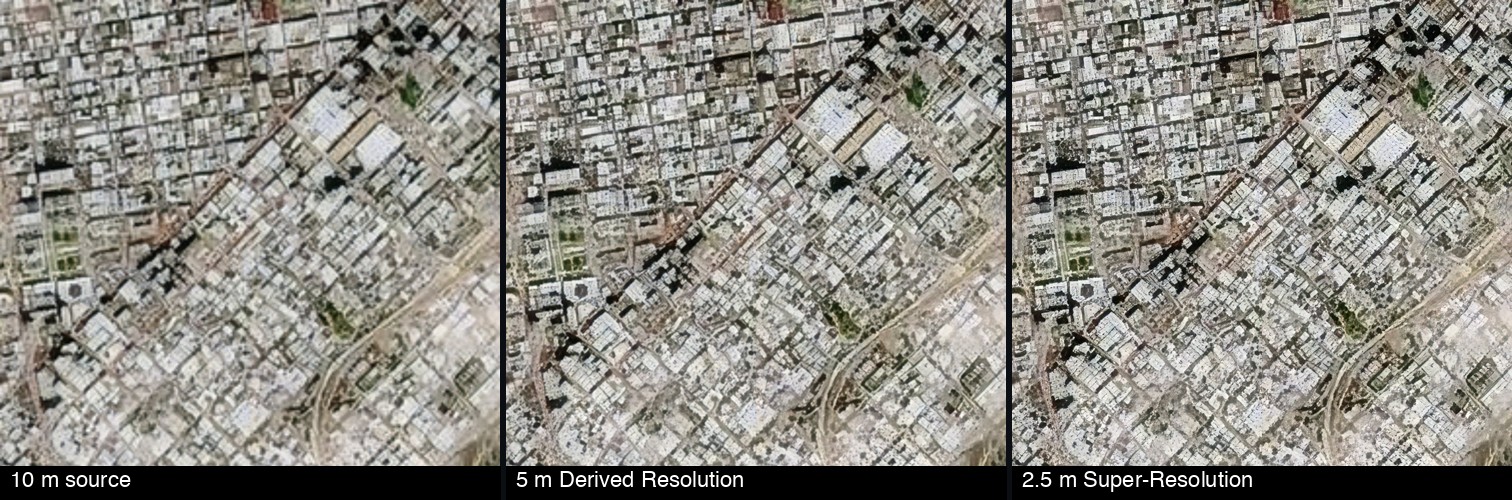
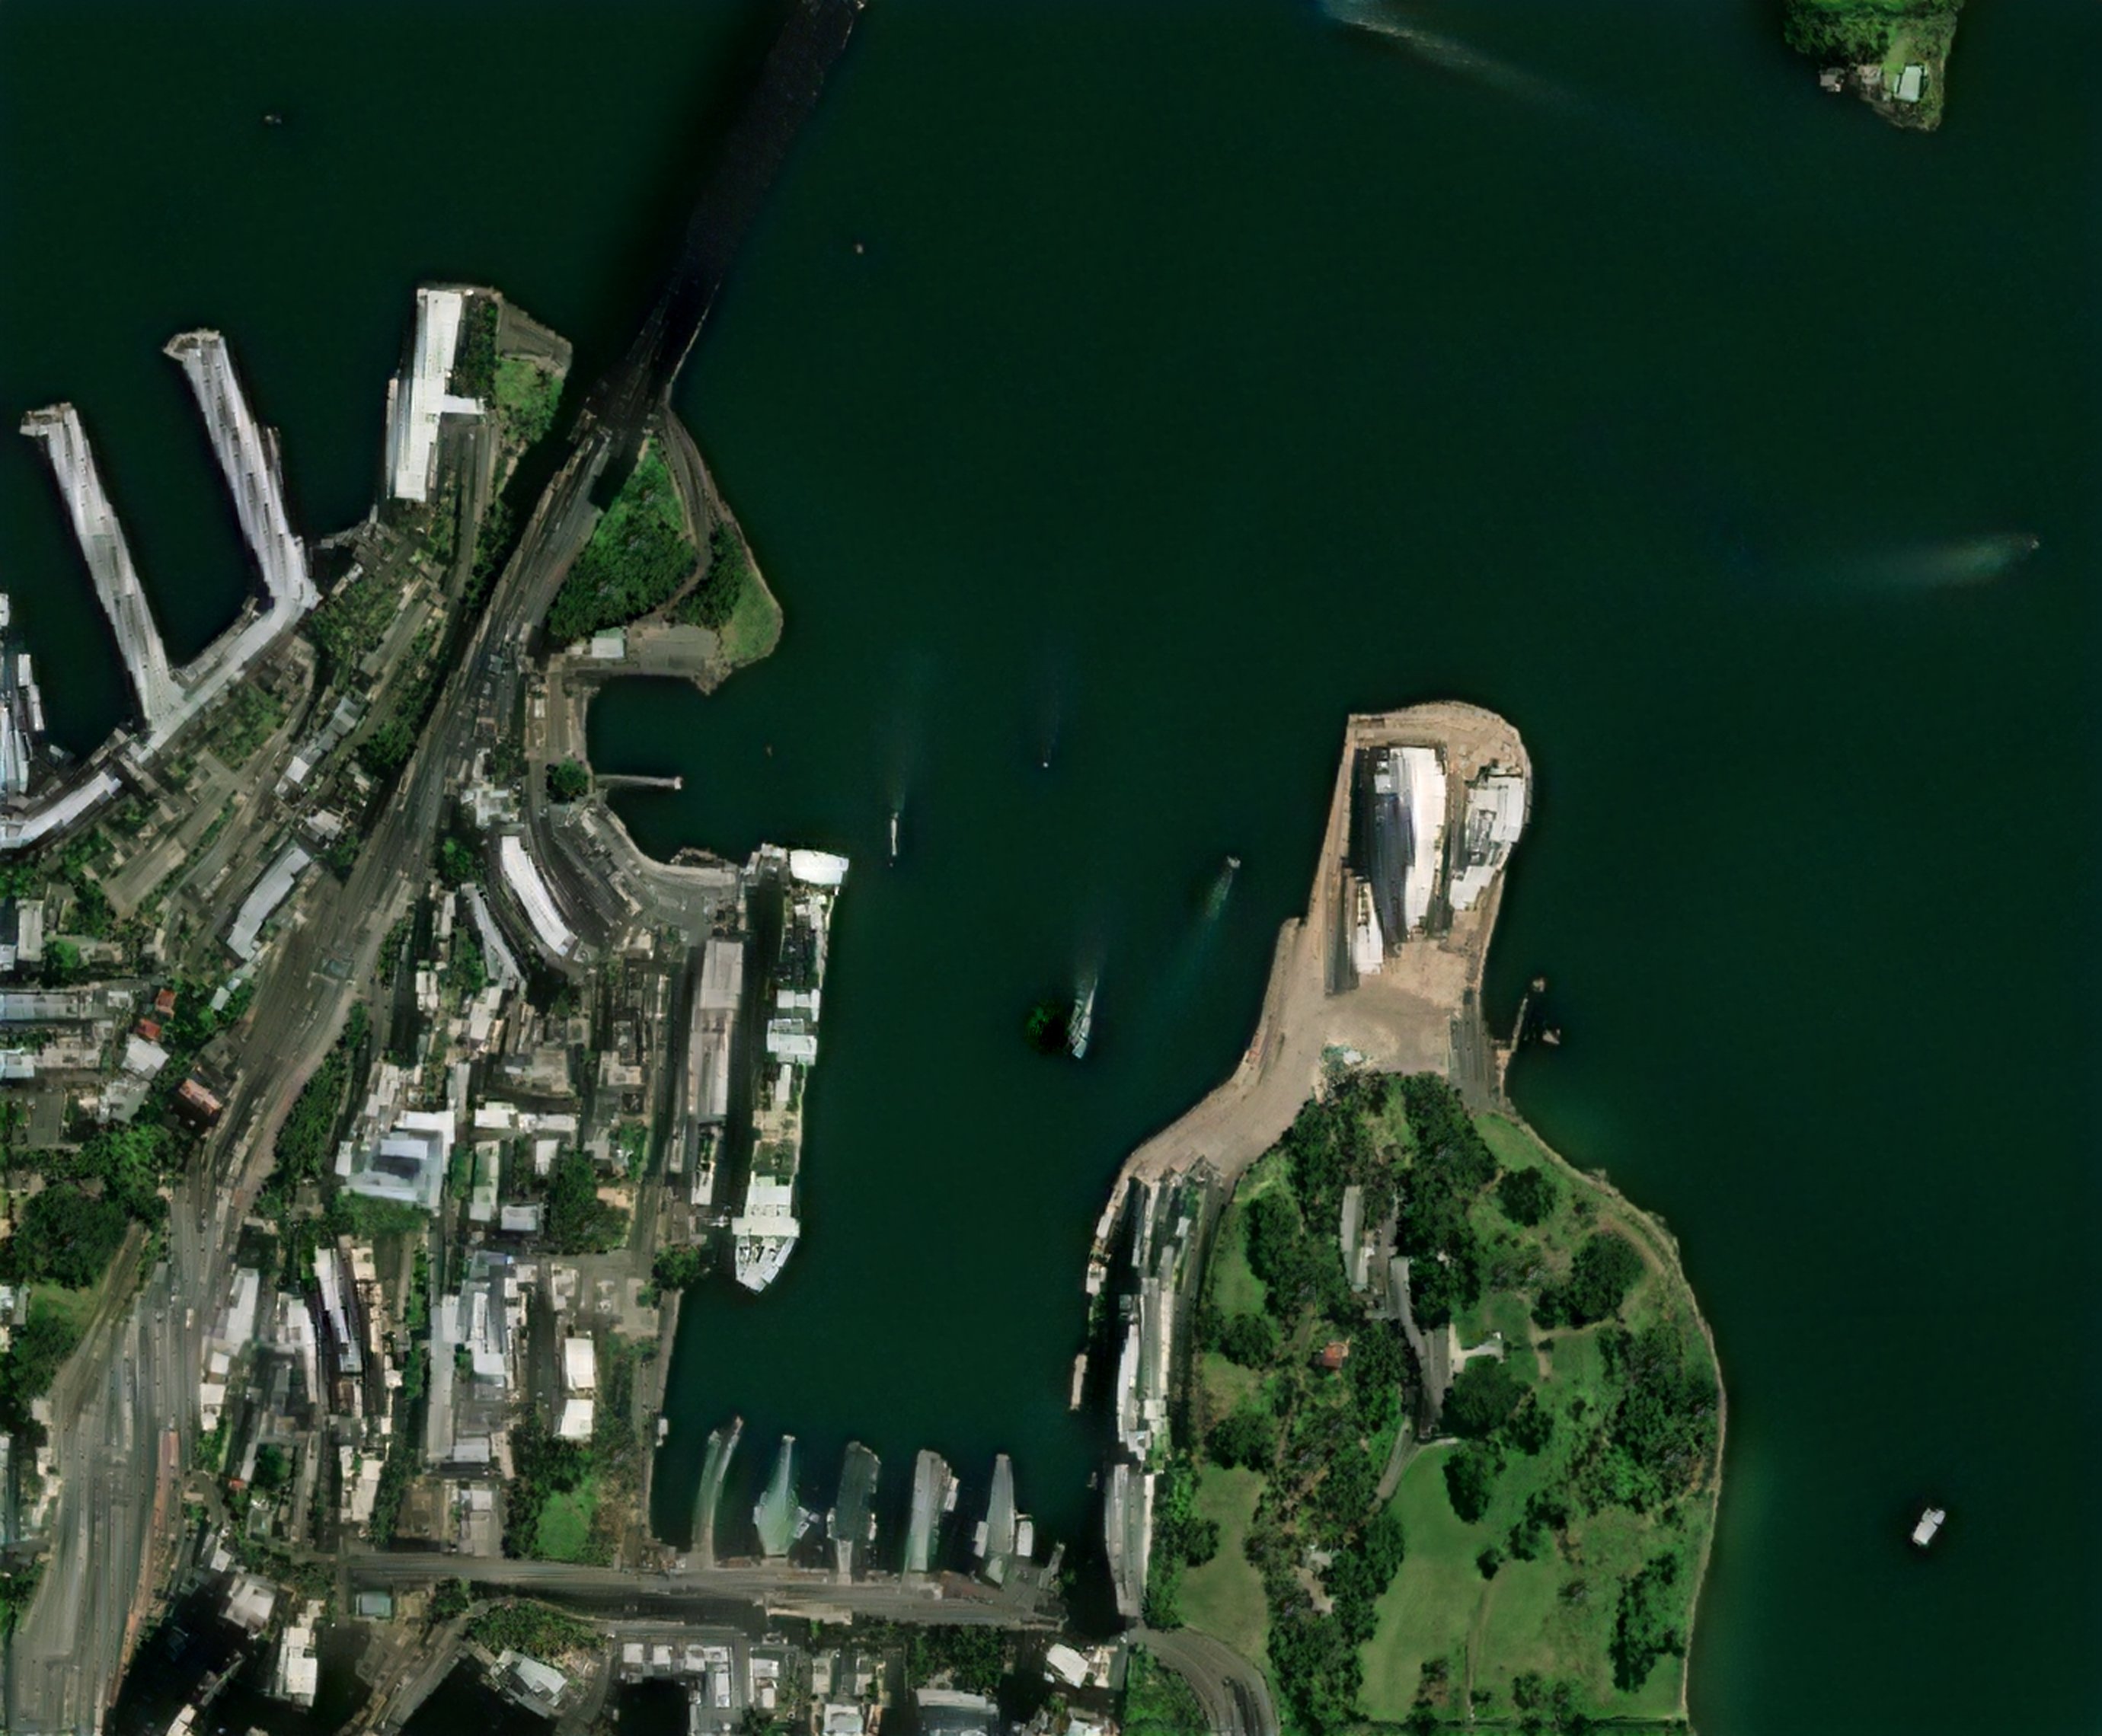
A quarterly, fully cloud-free worldwide basemap at 10m non-saturated true-colour, with 5m physics-based enhancement and 2.5m Fidelity Reconstruction (FR).
The quarterly cloudless visual basemap is based on Sentinel-2, and has the following capabilities:
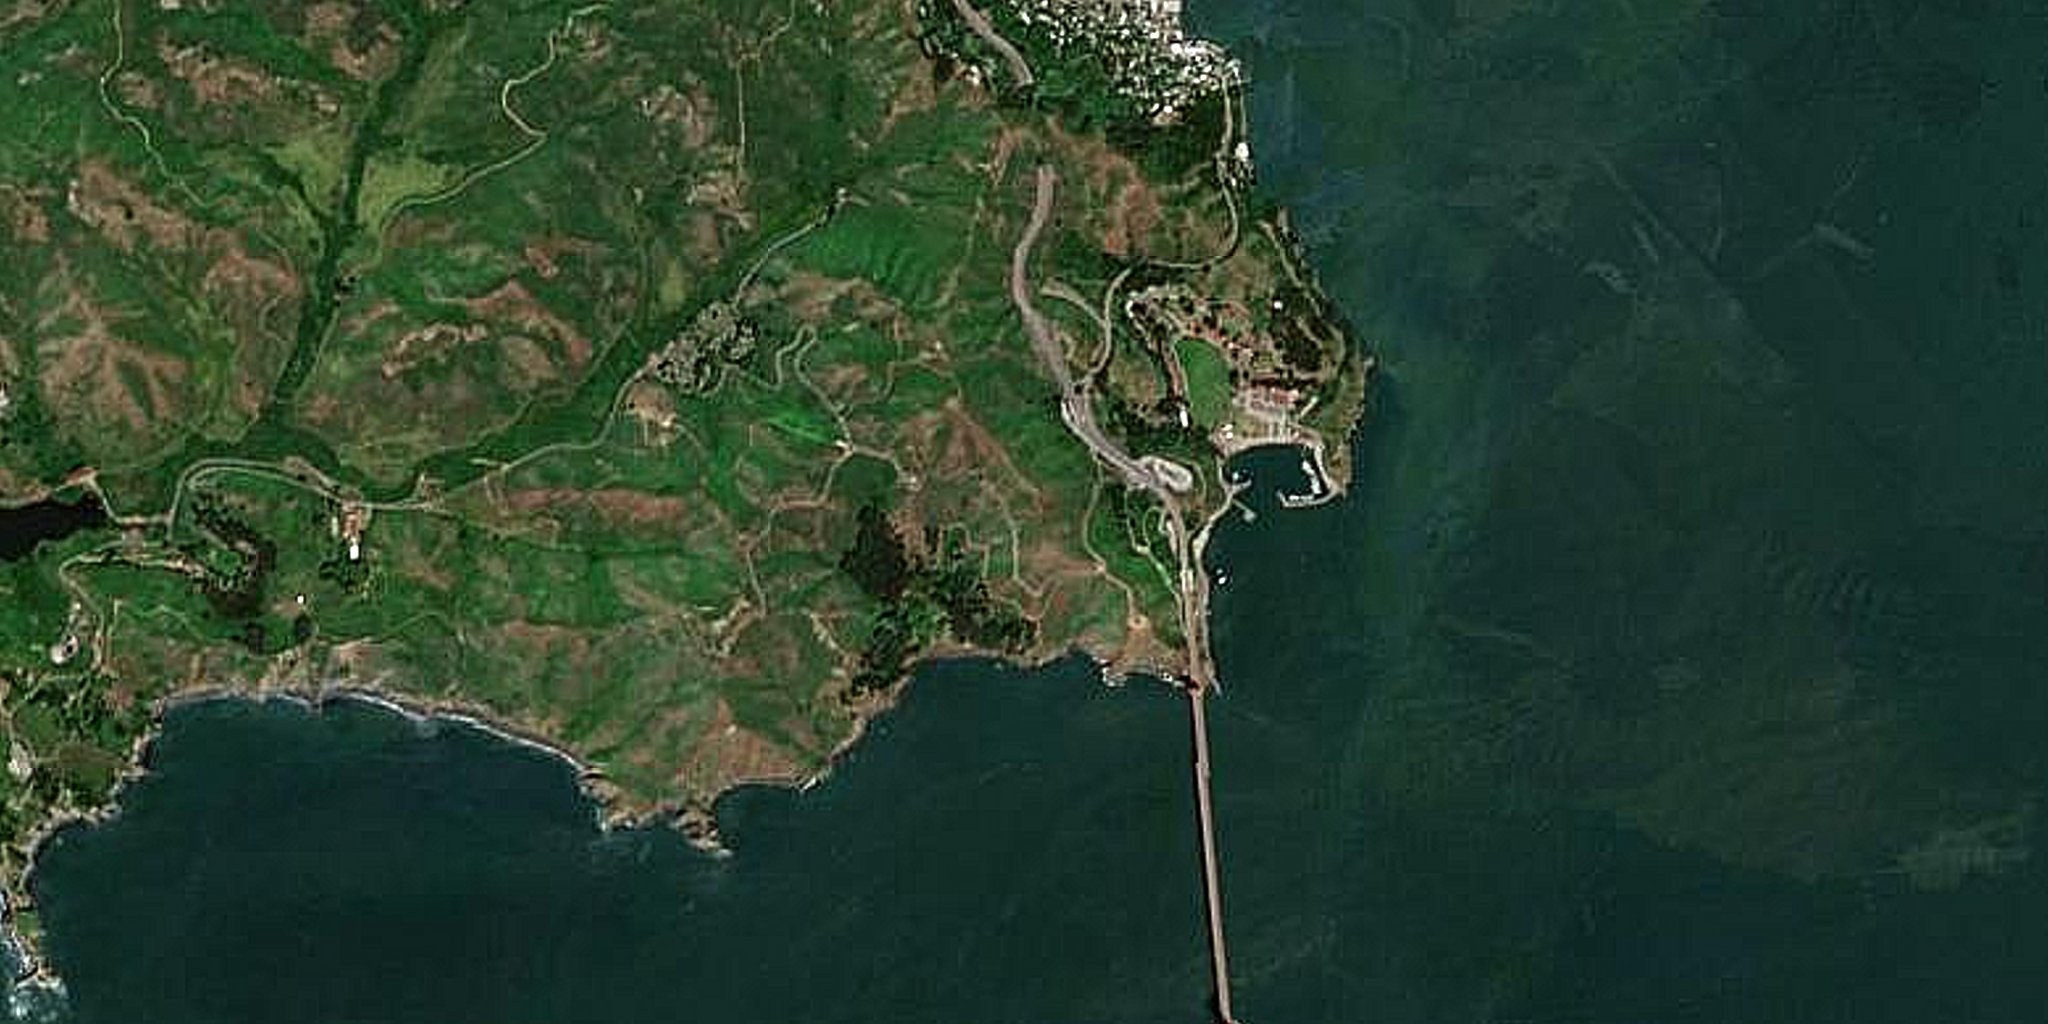
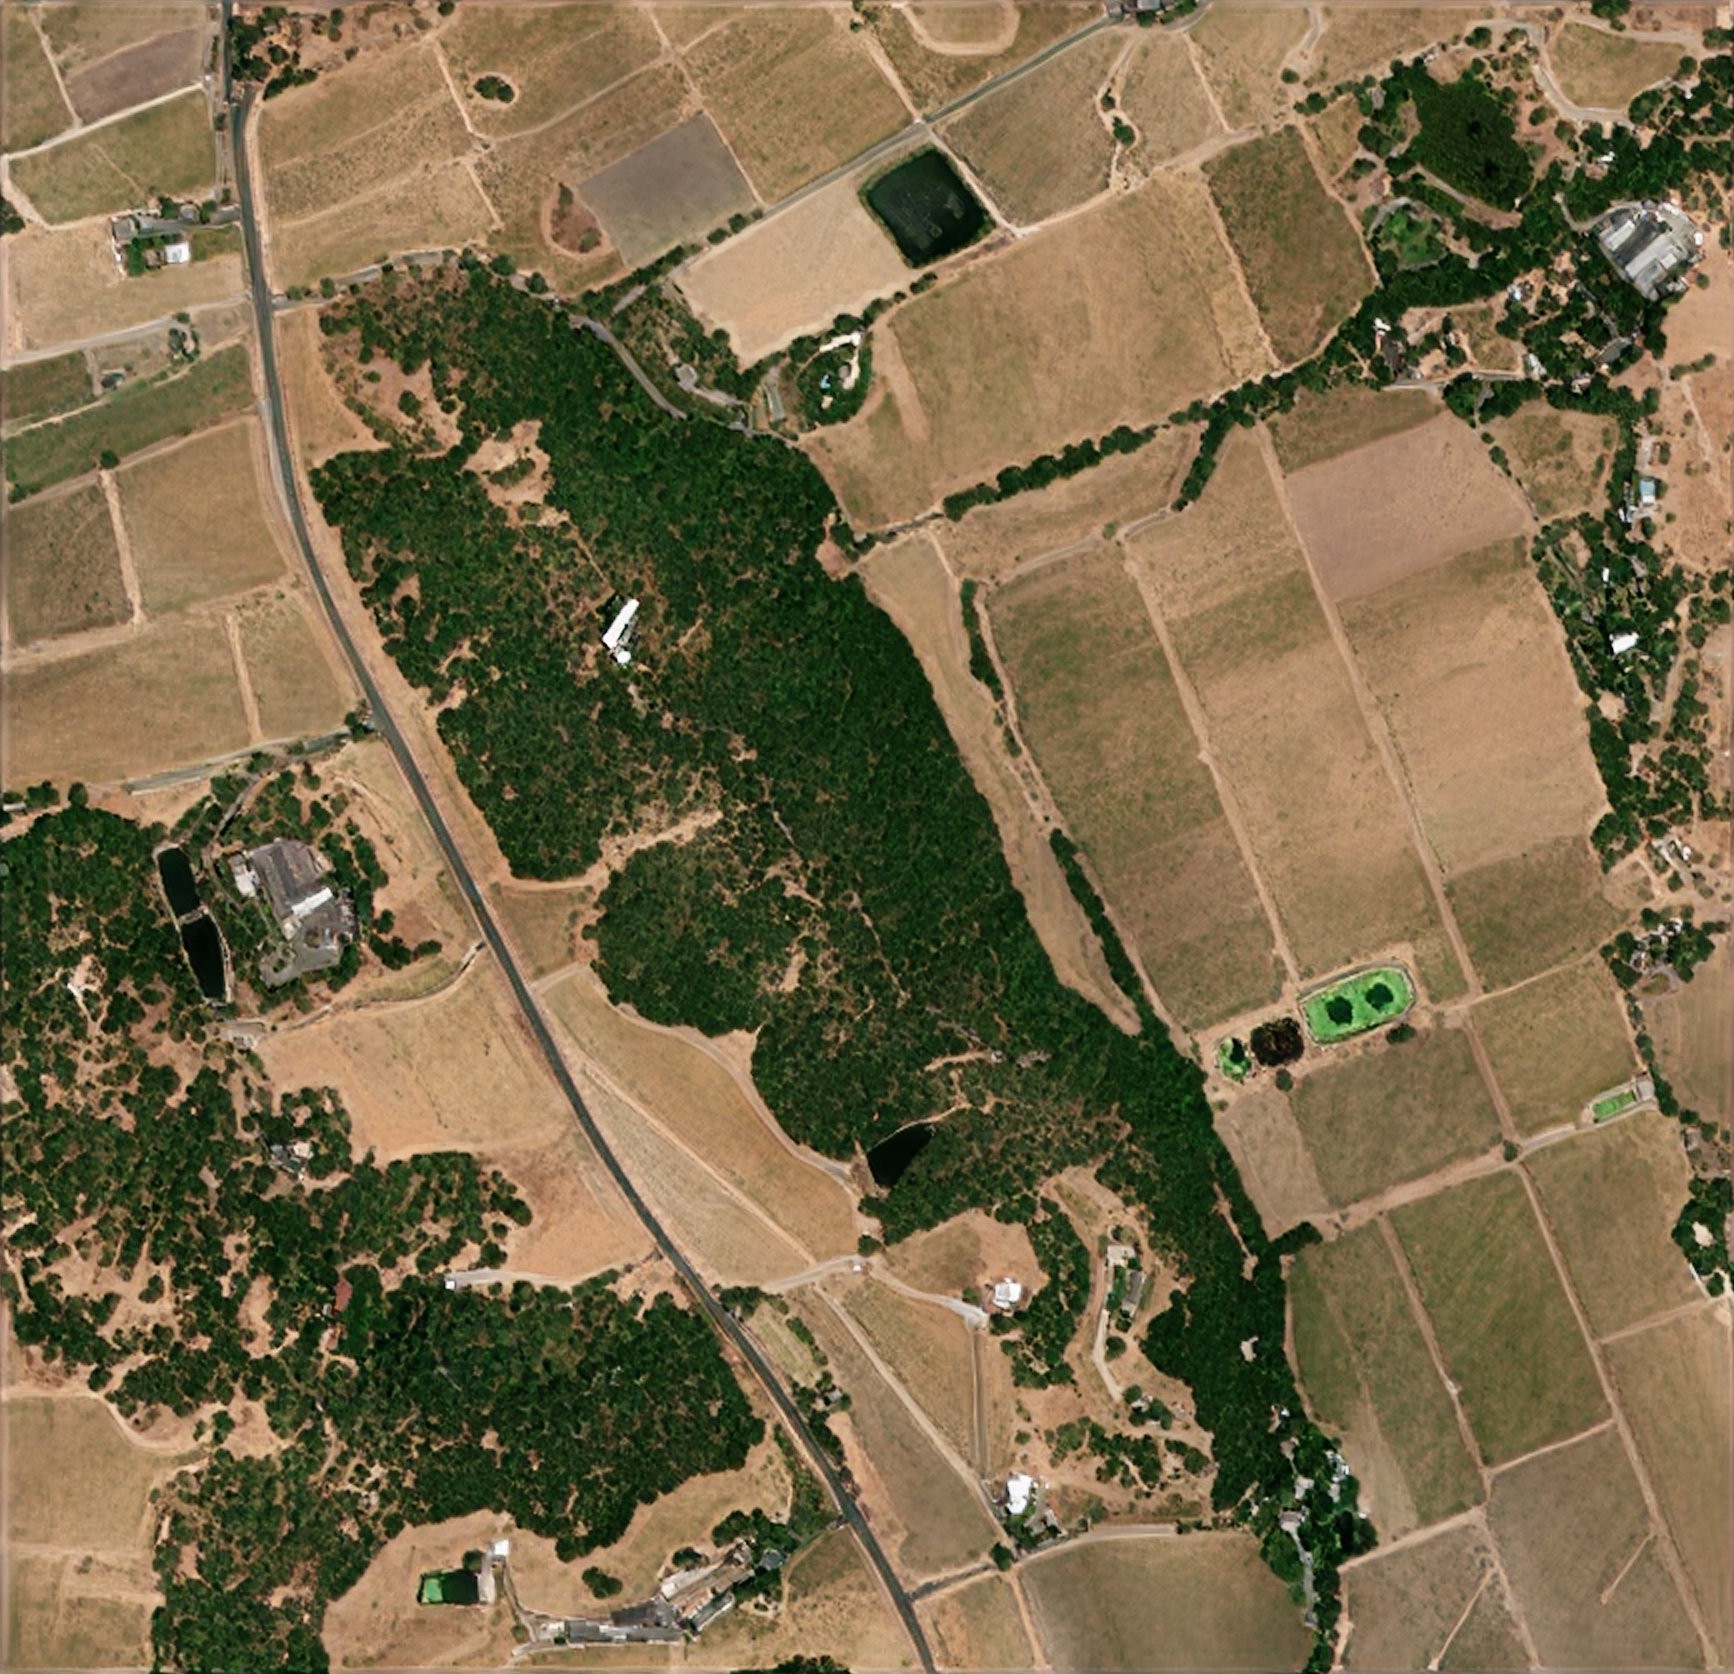
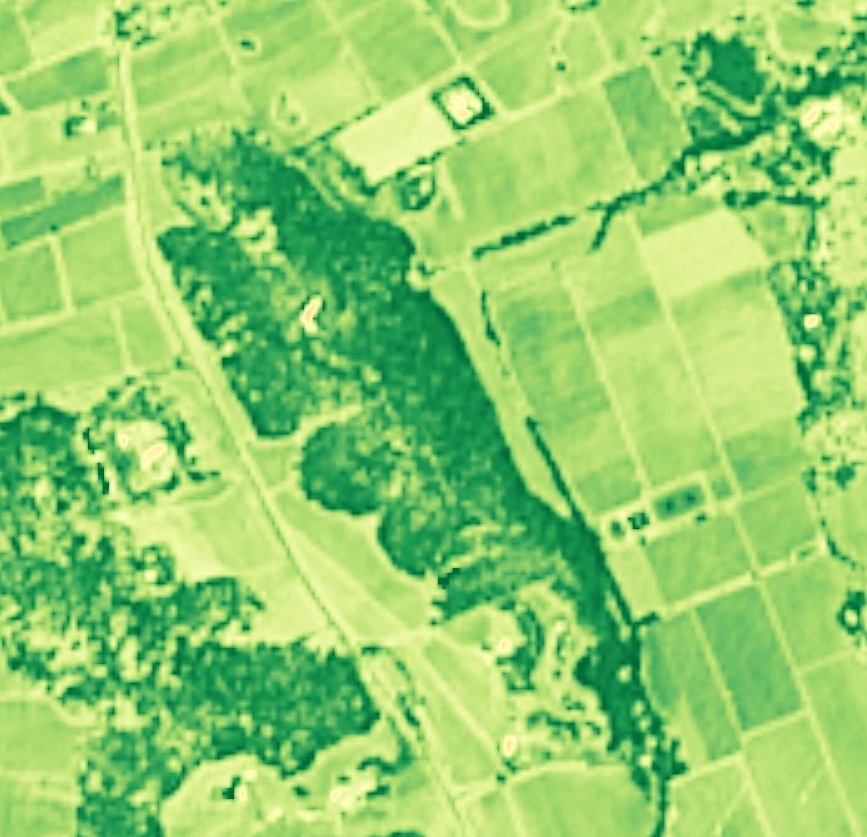
Customer-specified freshness, such as monthly — cloudless mosaic of latest data, visual at 1m GSD and multispectral indexes like NDVI at 2–4m GSD, at 50% of Enhanced Multispectral pricing.
The Fresh Optical Basemap lets you control freshness and provides visual and multispectral data, including the following capabilities:
Continuously updated basemap from ESA Sentinel-2 or PlanetScope — latest minimally-cloudy data per tile, latest stable data, and the previous image before a terrain change.
The Live Visual Basemap processes ESA Sentinel-2 or PlanetScope visual data continuously and provides an up-to-date basemap of the latest minimally-cloudy data captured, with the following capabilities:
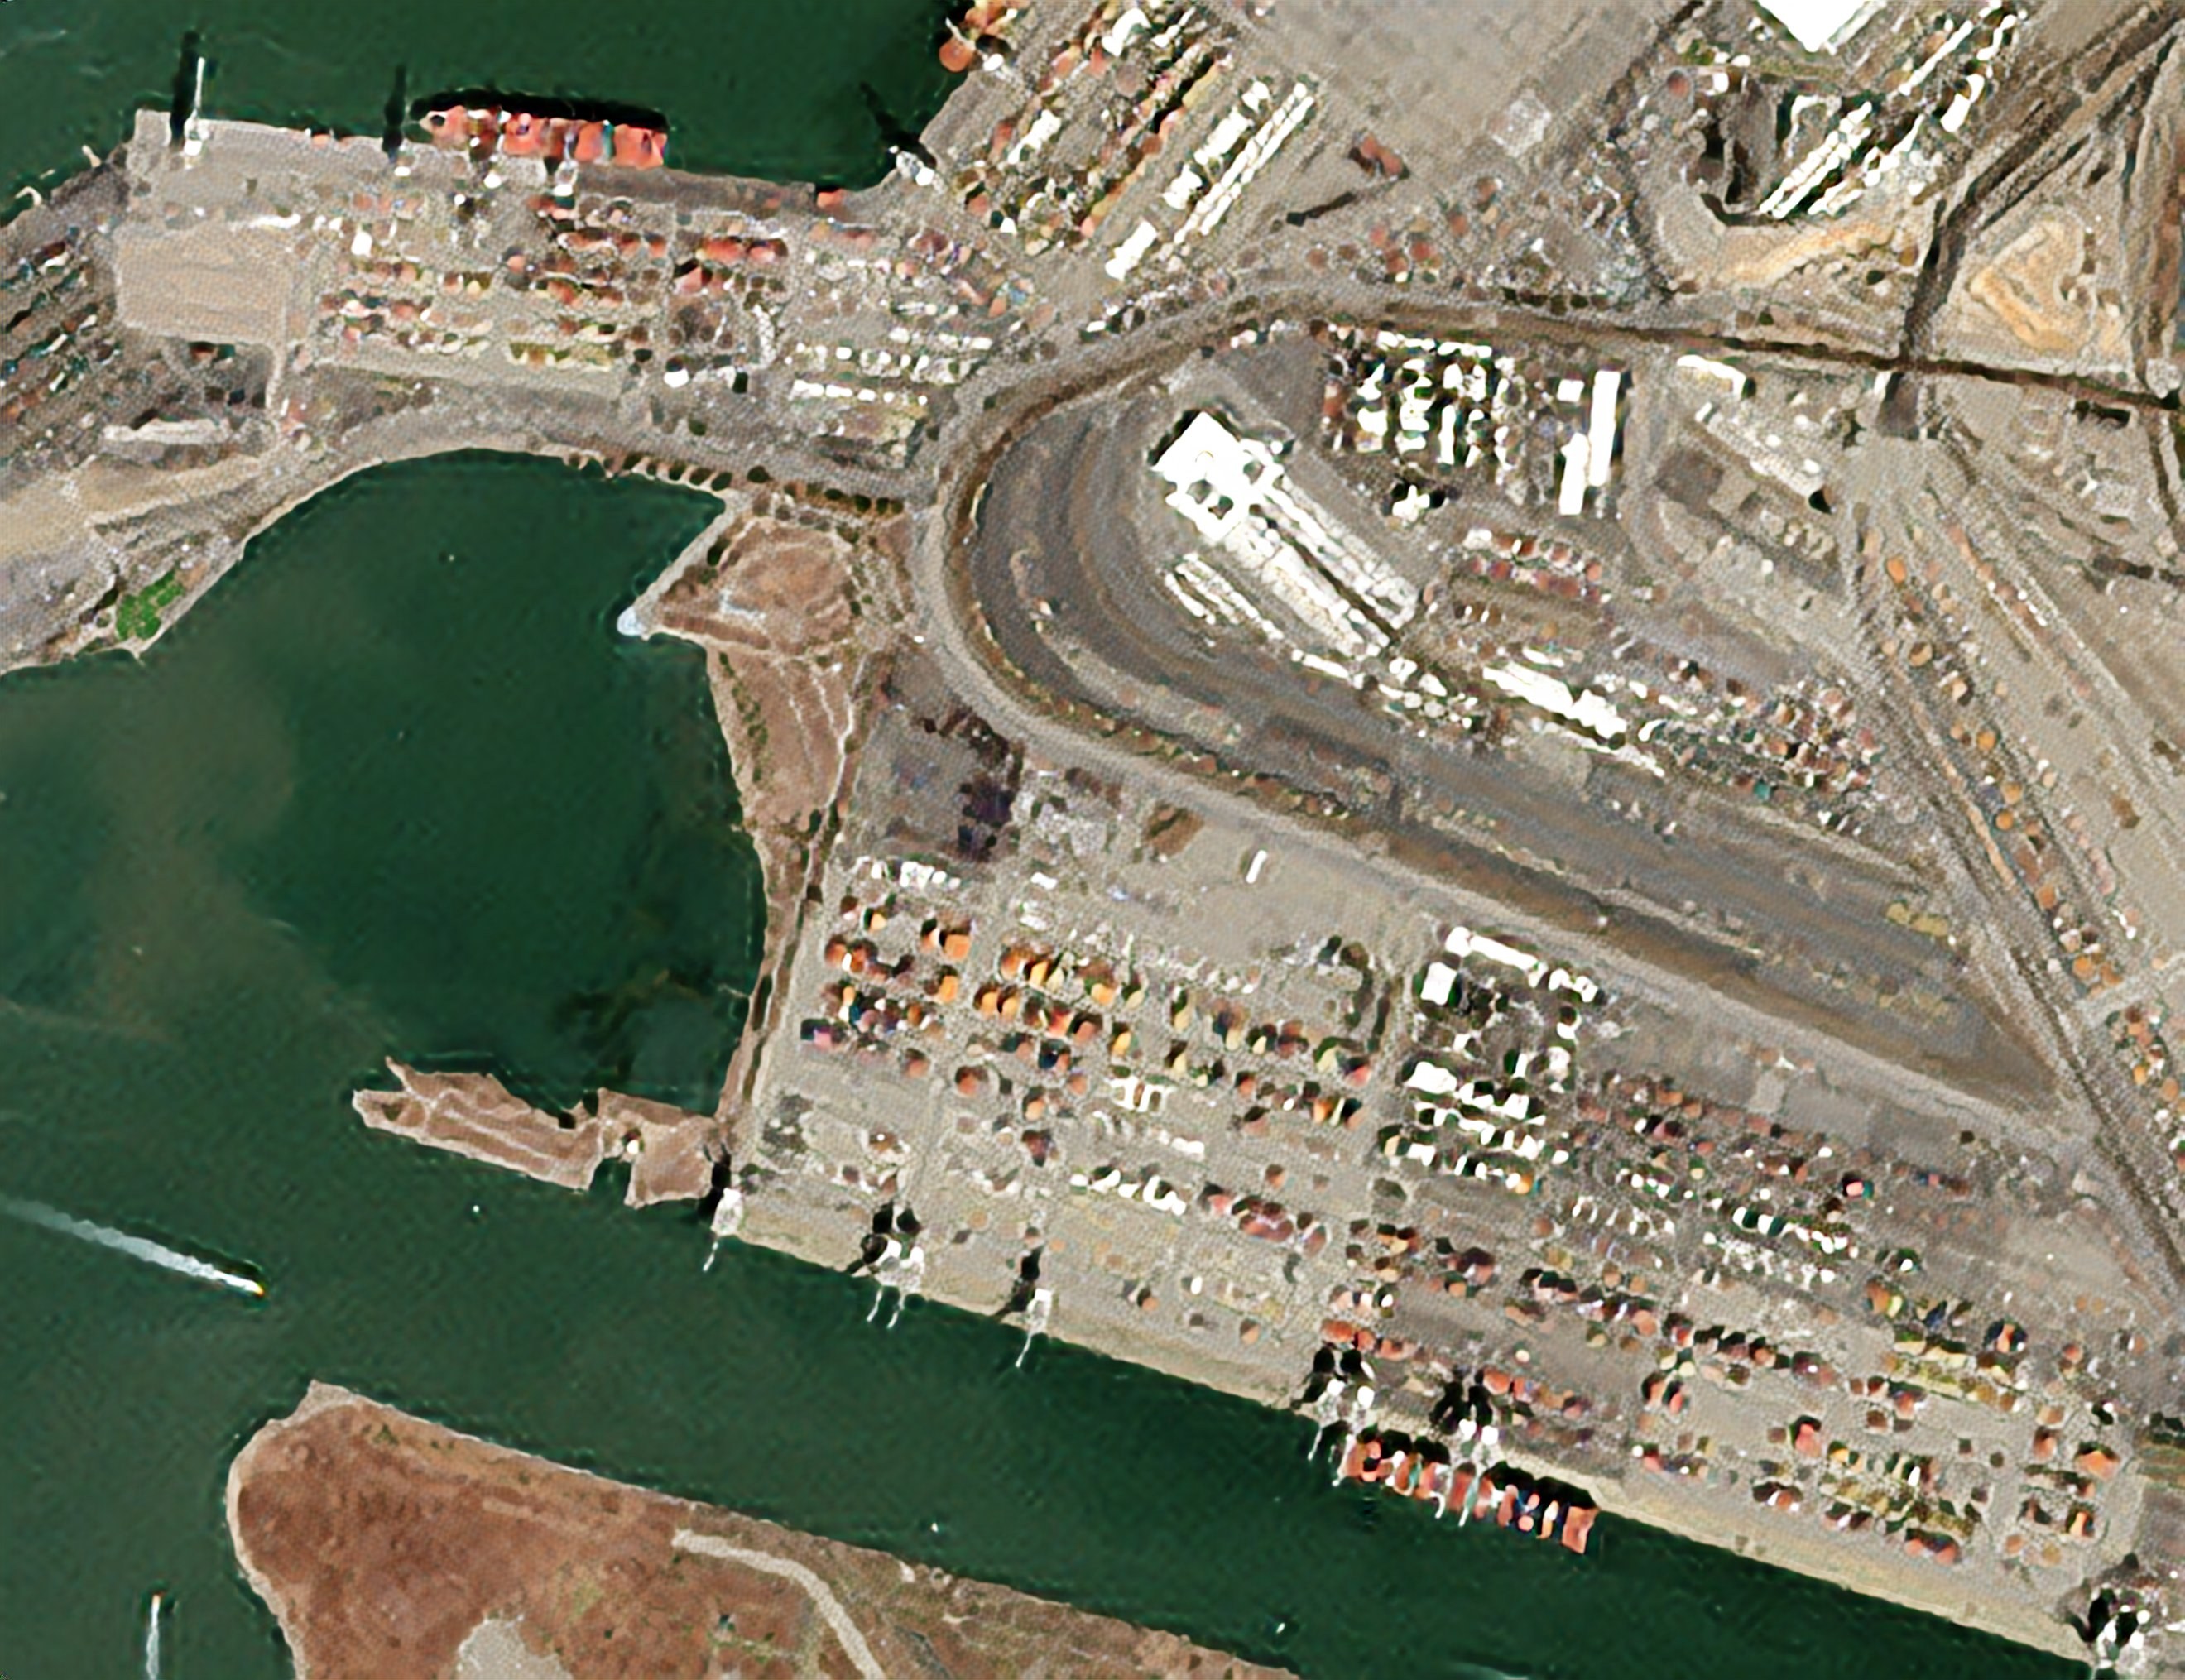
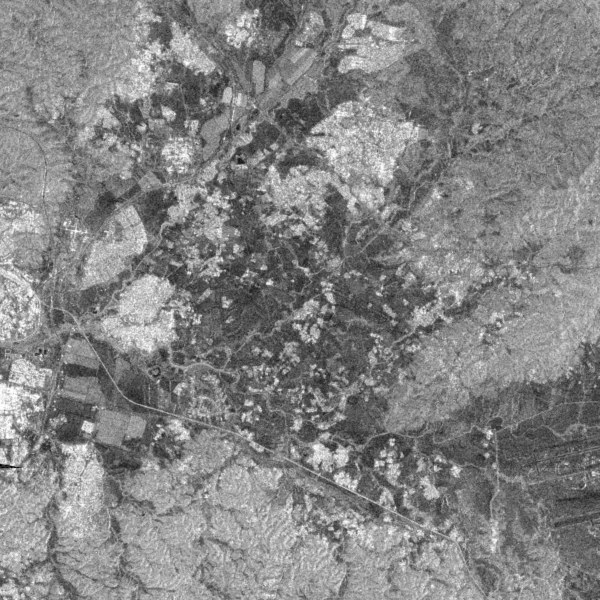
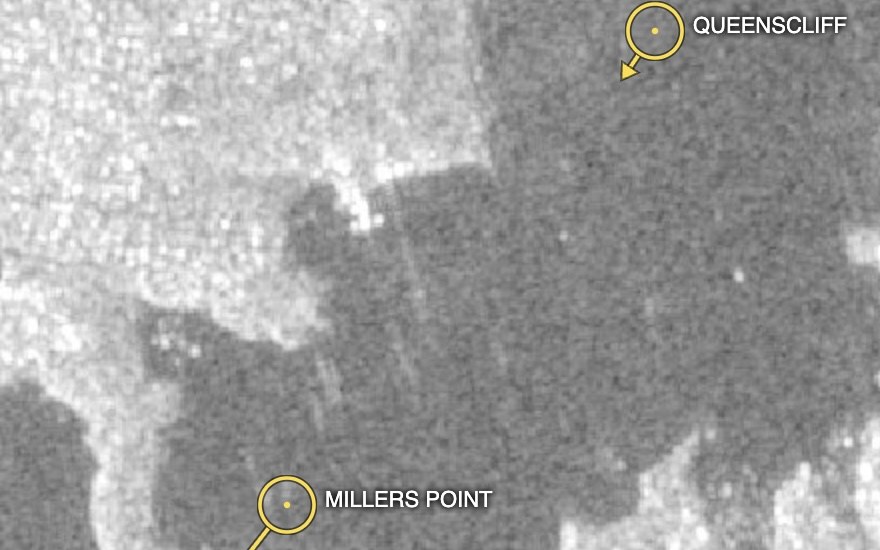
An ever-fresh worldwide SAR basemap from Sentinel-1 (and soon NISAR) — updated live with every new pass, 3–12 days everywhere, day, night and through cloud.
Many locations and seasons are extremely cloudy, where all satellite imagery other than SAR sources is not available. SAR data uses active radar which penetrates clouds and rain, but its data is different from optical and often requires expertise to interpret.
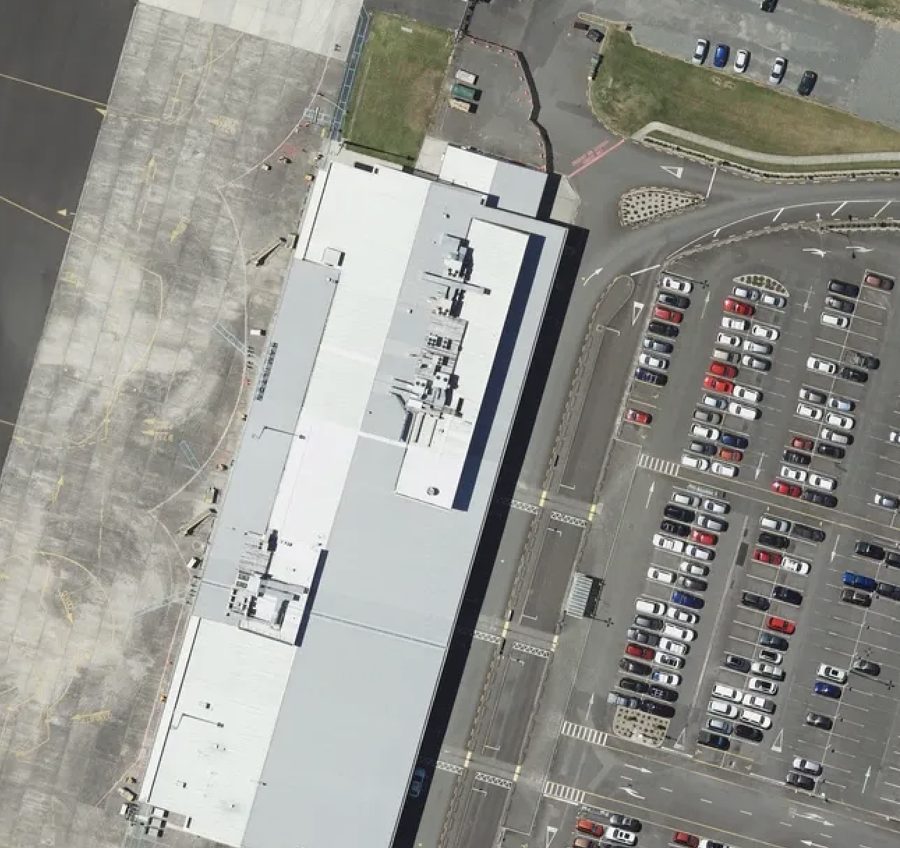
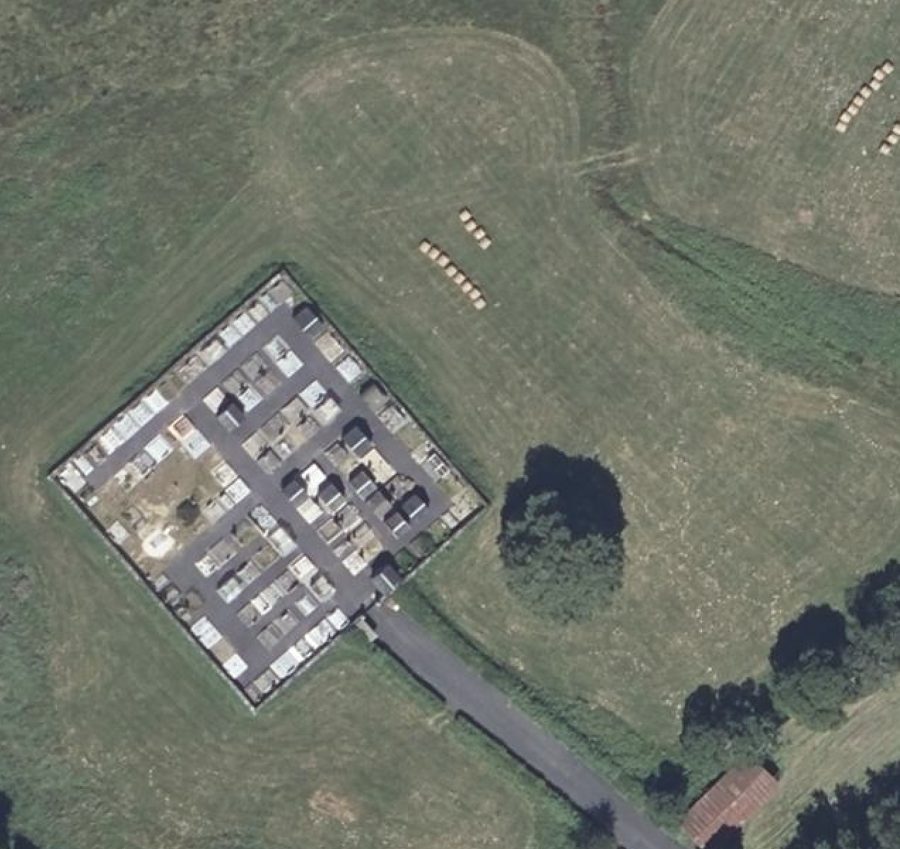
Government aerial basemaps from 25 countries (18 working at last check, March 2026) through a single standardized tile server; GSD varies widely, up to 1cm in specific locations. Flat $50,000/year tile access.
Many countries make an aerial basemap of some or all of their territories available, some as tile servers and some as accessible AOIs, using different access methods.
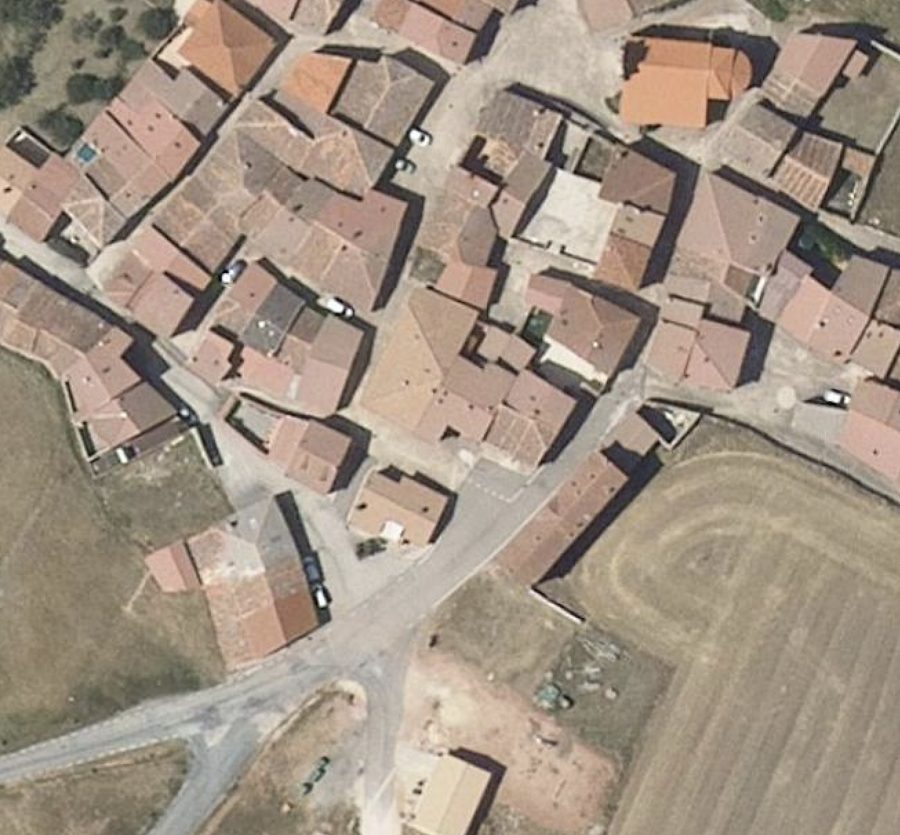
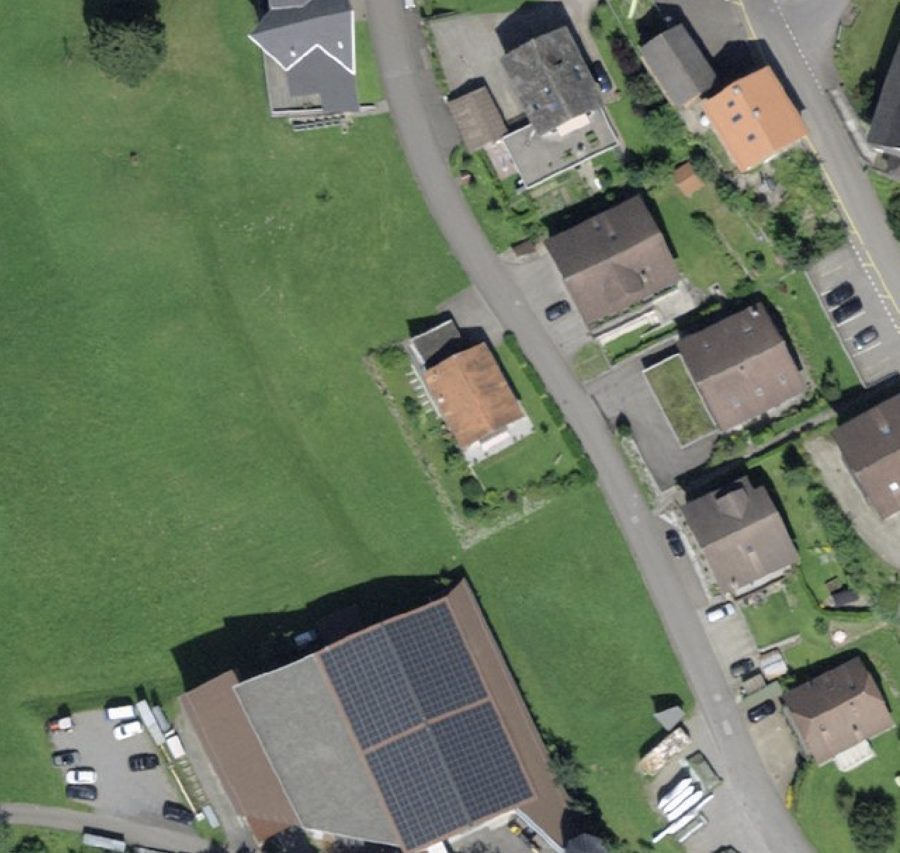
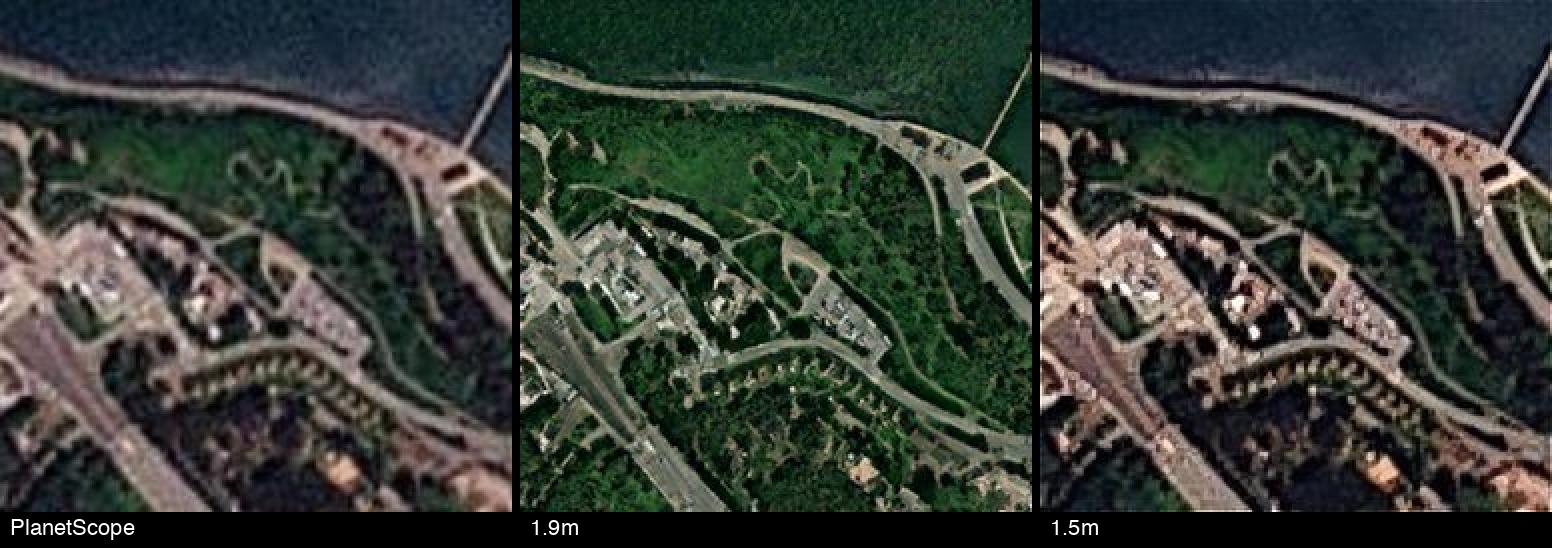
Worldwide visual imagery in more detail than the source — Sentinel-2 to 1m (50cm with x2 super-resolution), PlanetScope to 1.5m, Landsat to 3.75m; archives from 1995.
Visual satellite data has many uses, including:
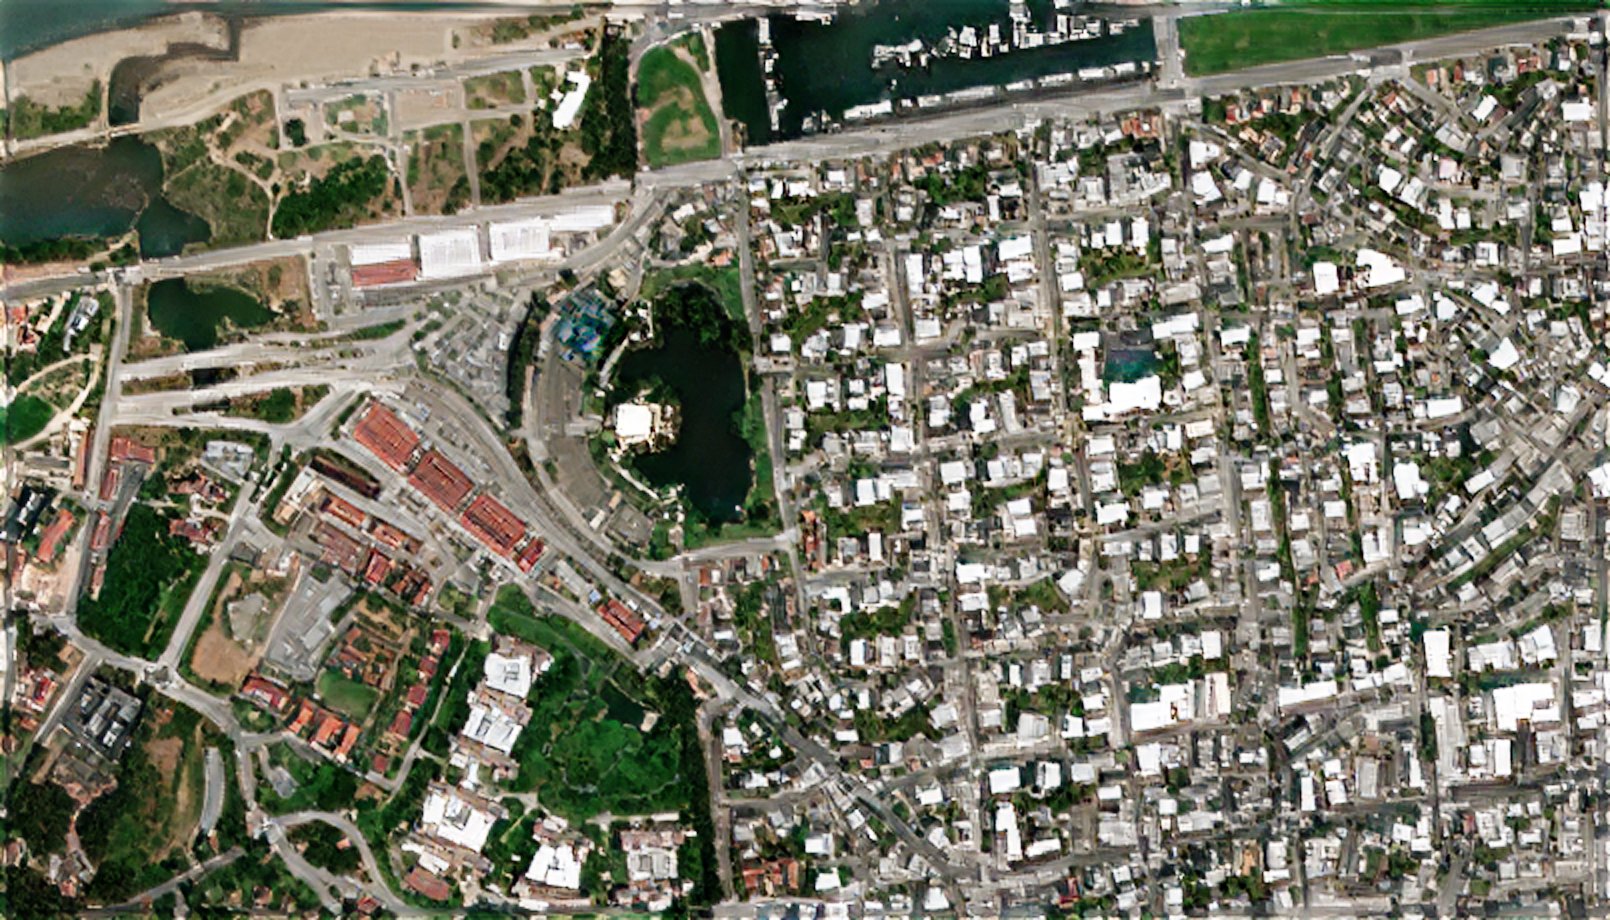
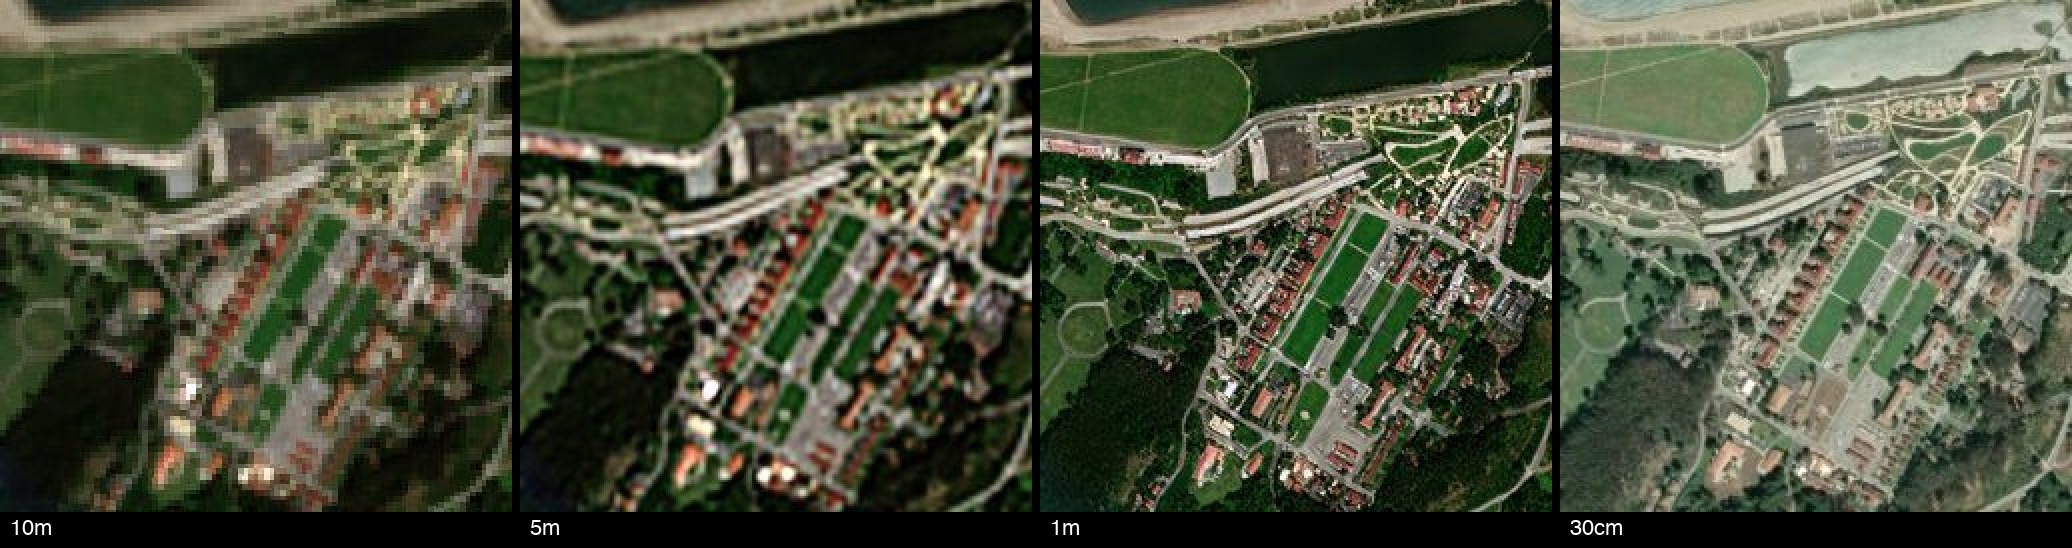
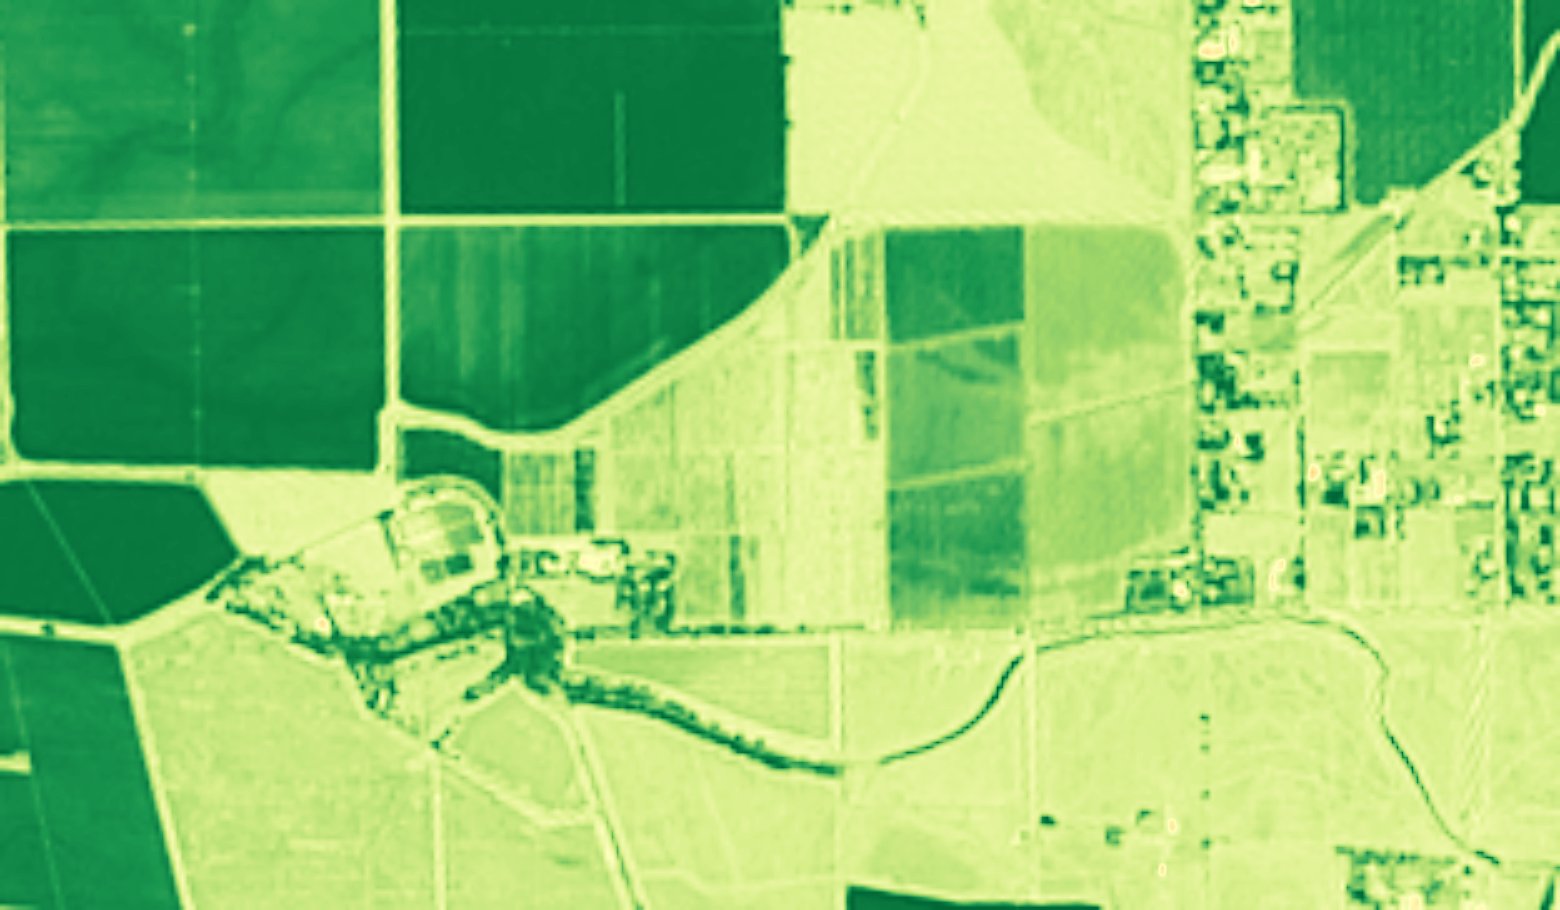
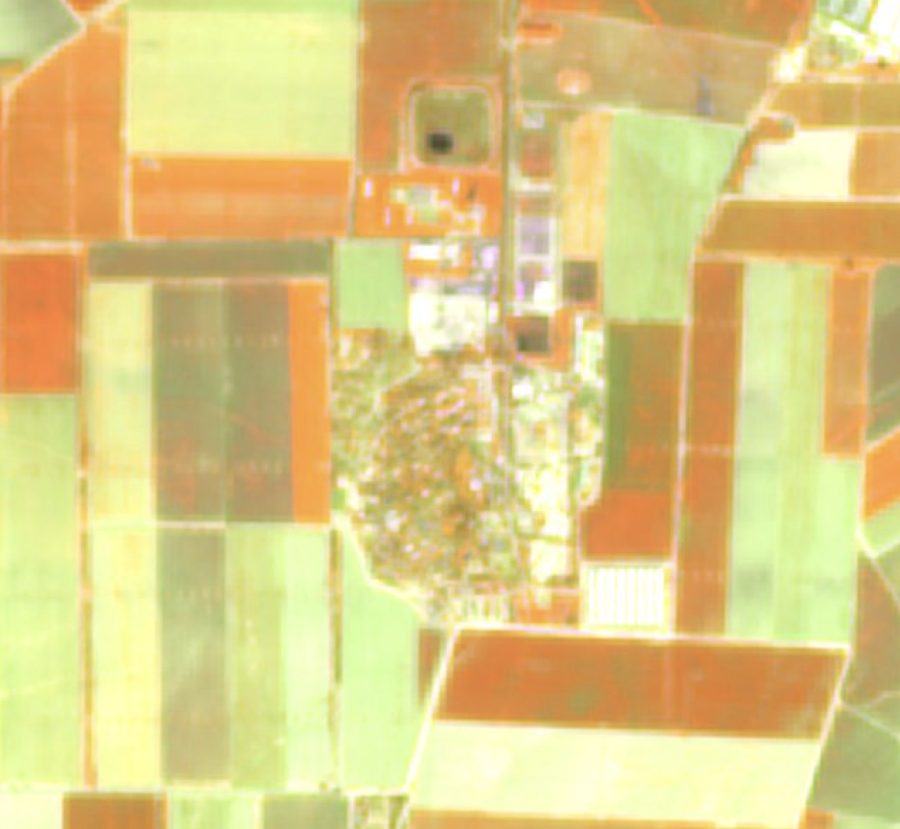
Ten calibrated spectral bands at 2–4m, includes 1m Enhanced Visual — the analytical engine behind NDVI, moisture, burn and mineral indices.
Multispectral satellite data has a wide range of uses, including:
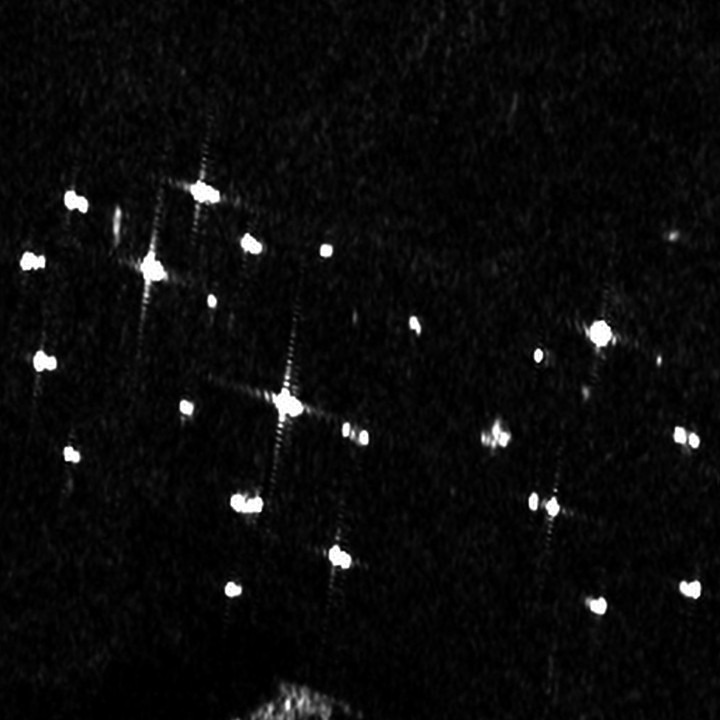
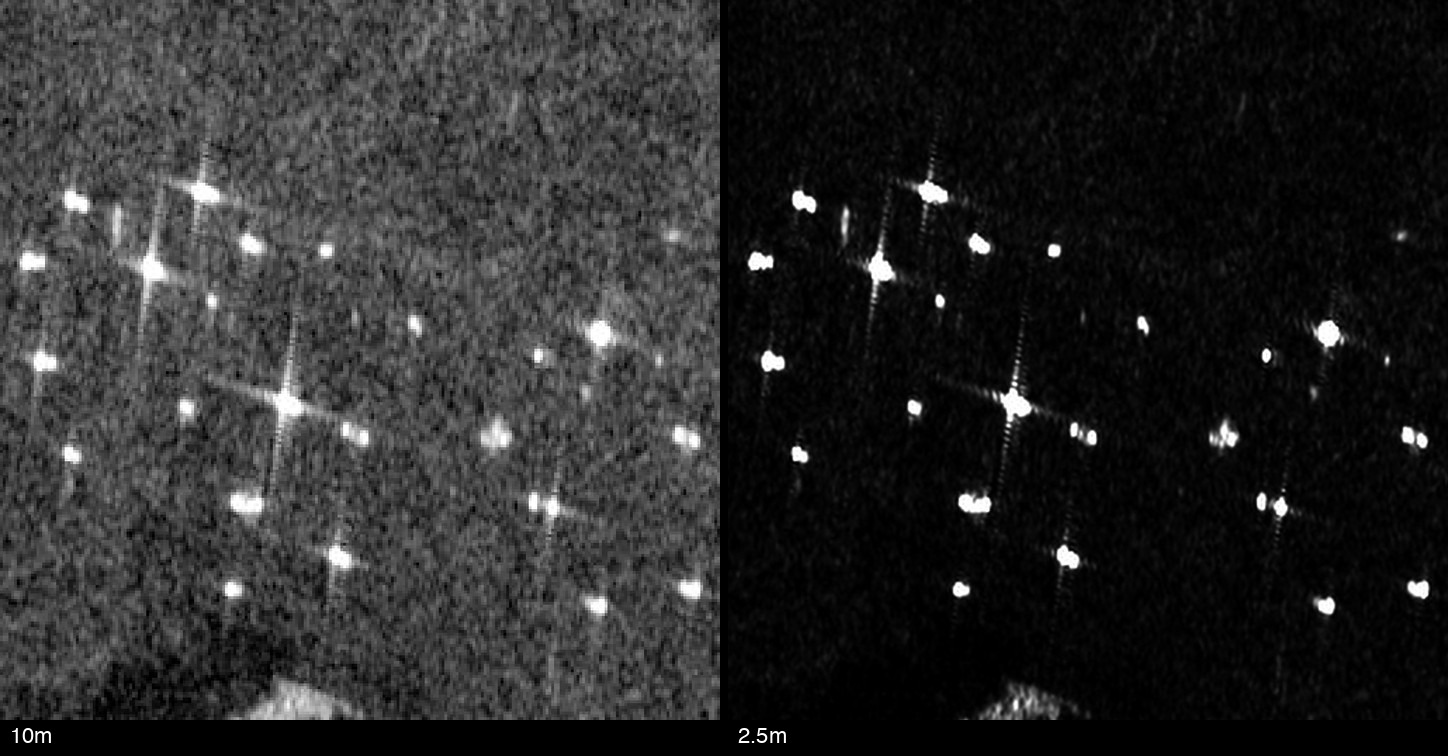
All-weather Sentinel-1 C-band radar at 2.5m Fidelity Reconstruction (FR), terrain-corrected (RTC), both polarities and both orbit passes — day, night, through cloud, every 3–12 days.
Synthetic Aperture Radar has a wide range of uses, including:
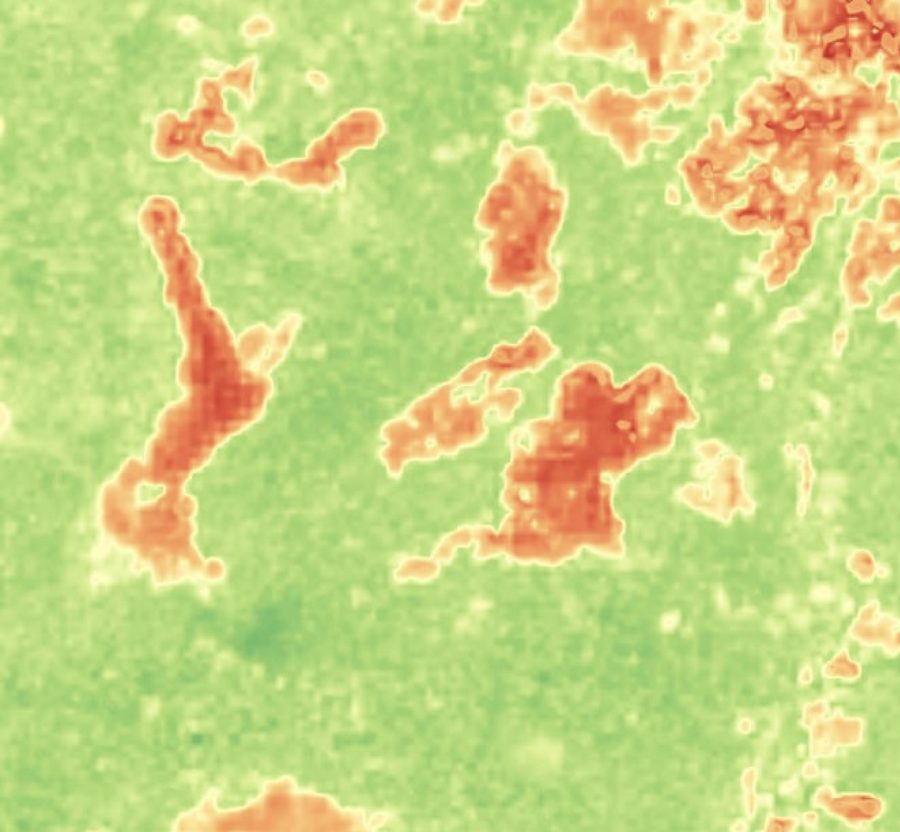
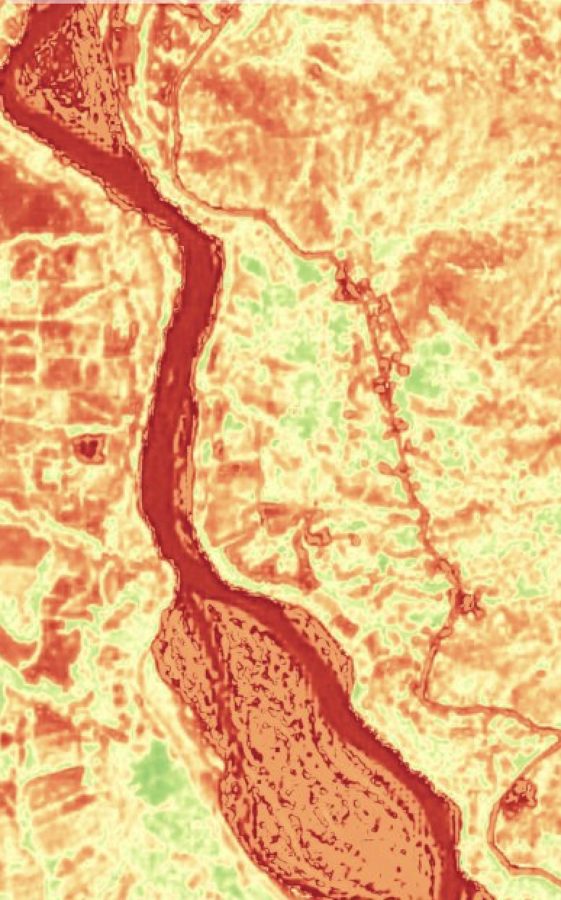
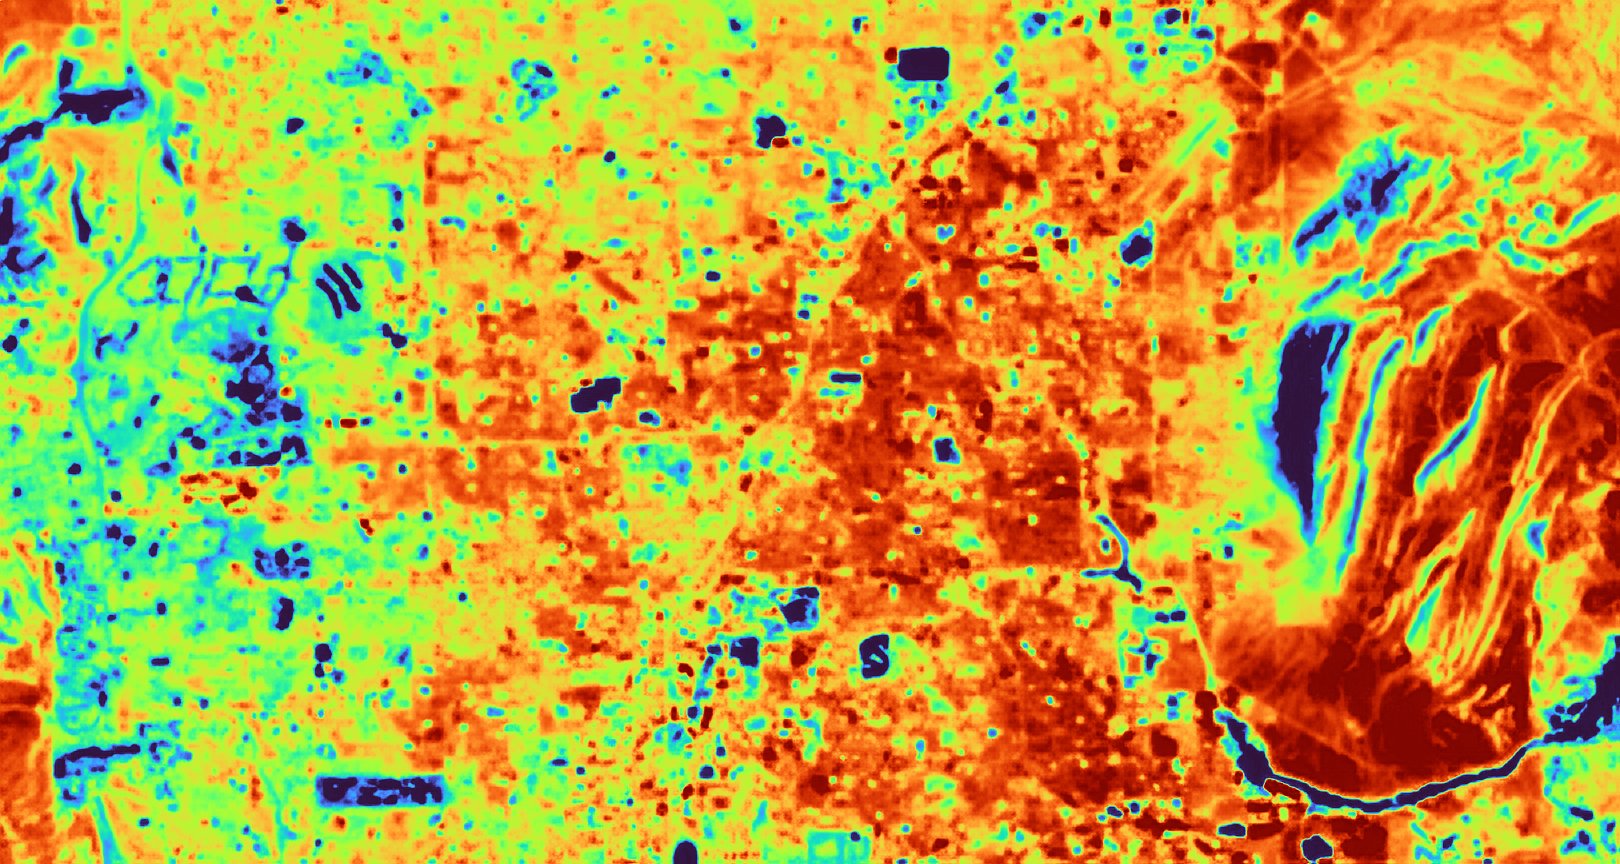
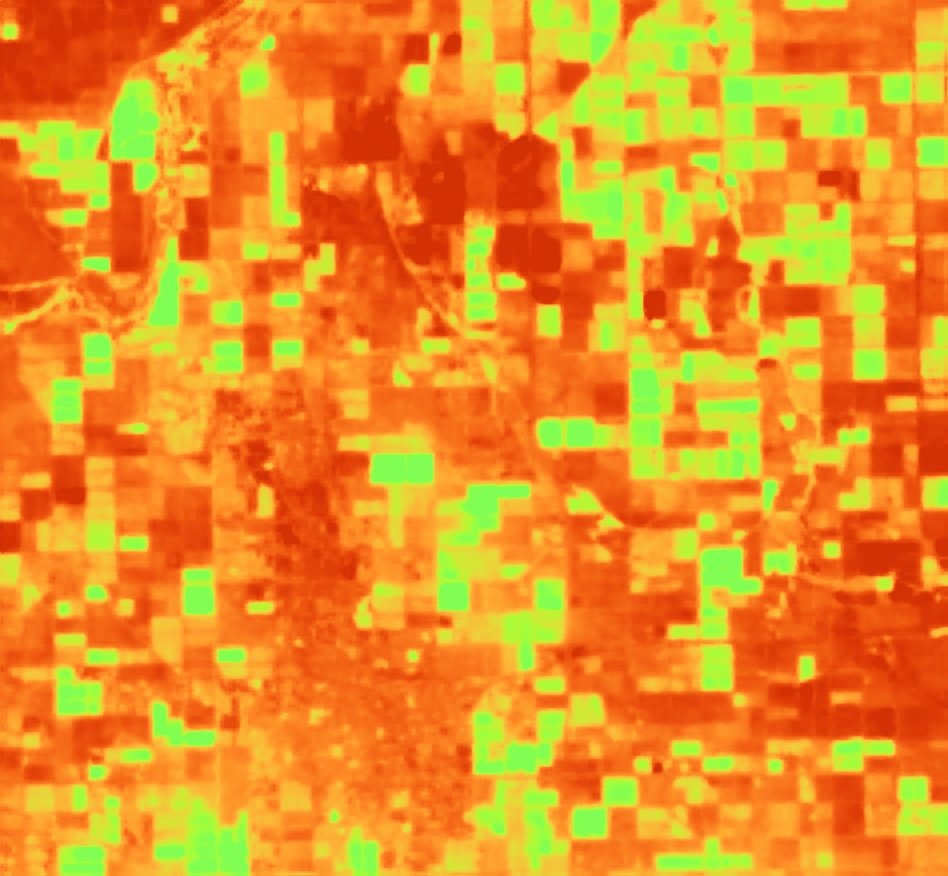
Landsat two-band thermal-infrared at 25m faithful super-resolution — surface temperature and thermal anomalies.
Thermal satellite imagery has special uses, including:
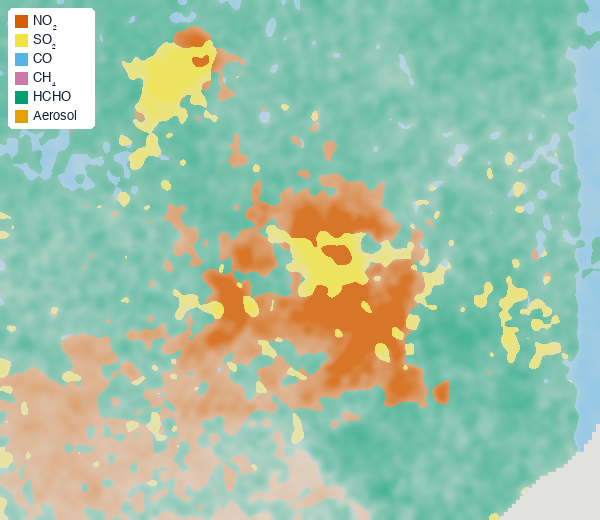
Up-to-date (last 2–4 weeks running average) global 6-gas monitoring — NO₂, SO₂, CO, CH₄, HCHO and aerosols — at 1.4km faithful machine learning projection, absolute and year-on-year.
Satellite air-quality data has a unique set of uses, including:
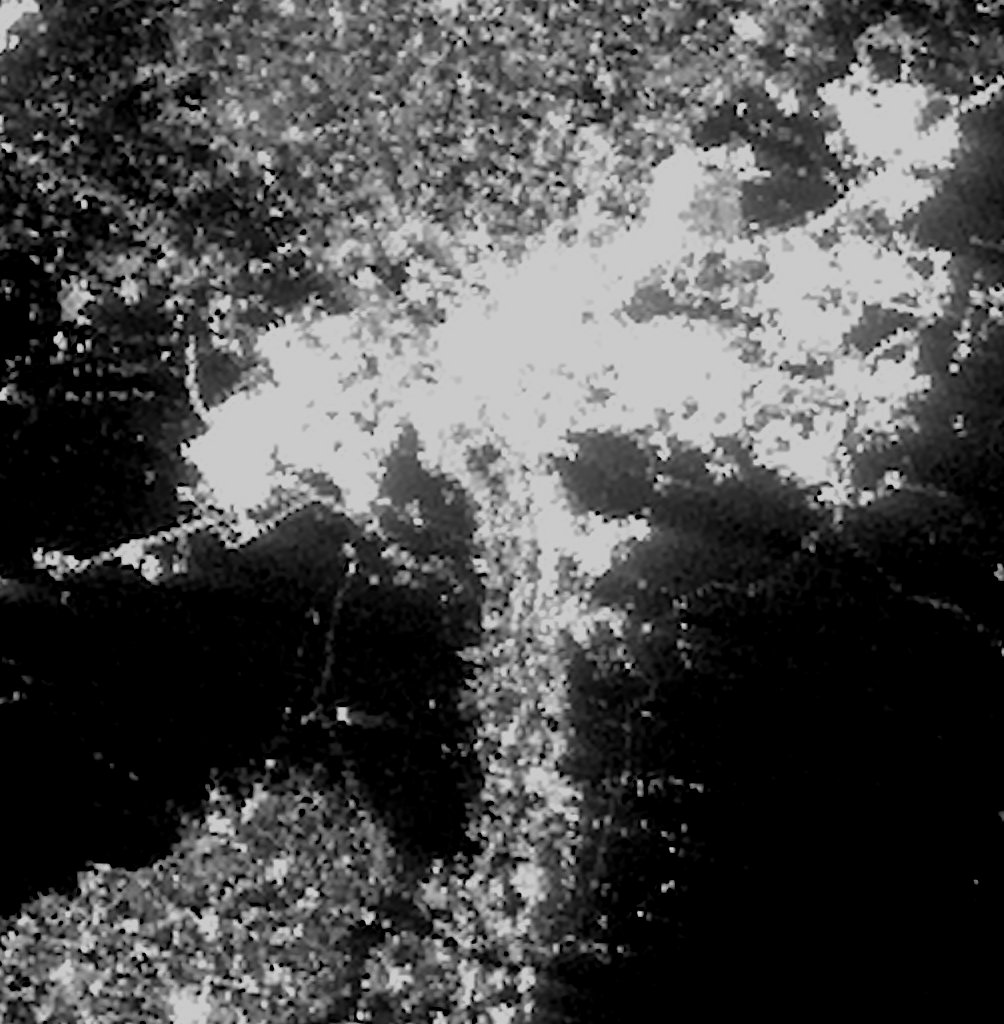
Nightly 125m night-lights, faithful projection from VIIRS, for power, outage and activity tracking.
Nightlight satellite imagery has capabilities not available otherwise, including:
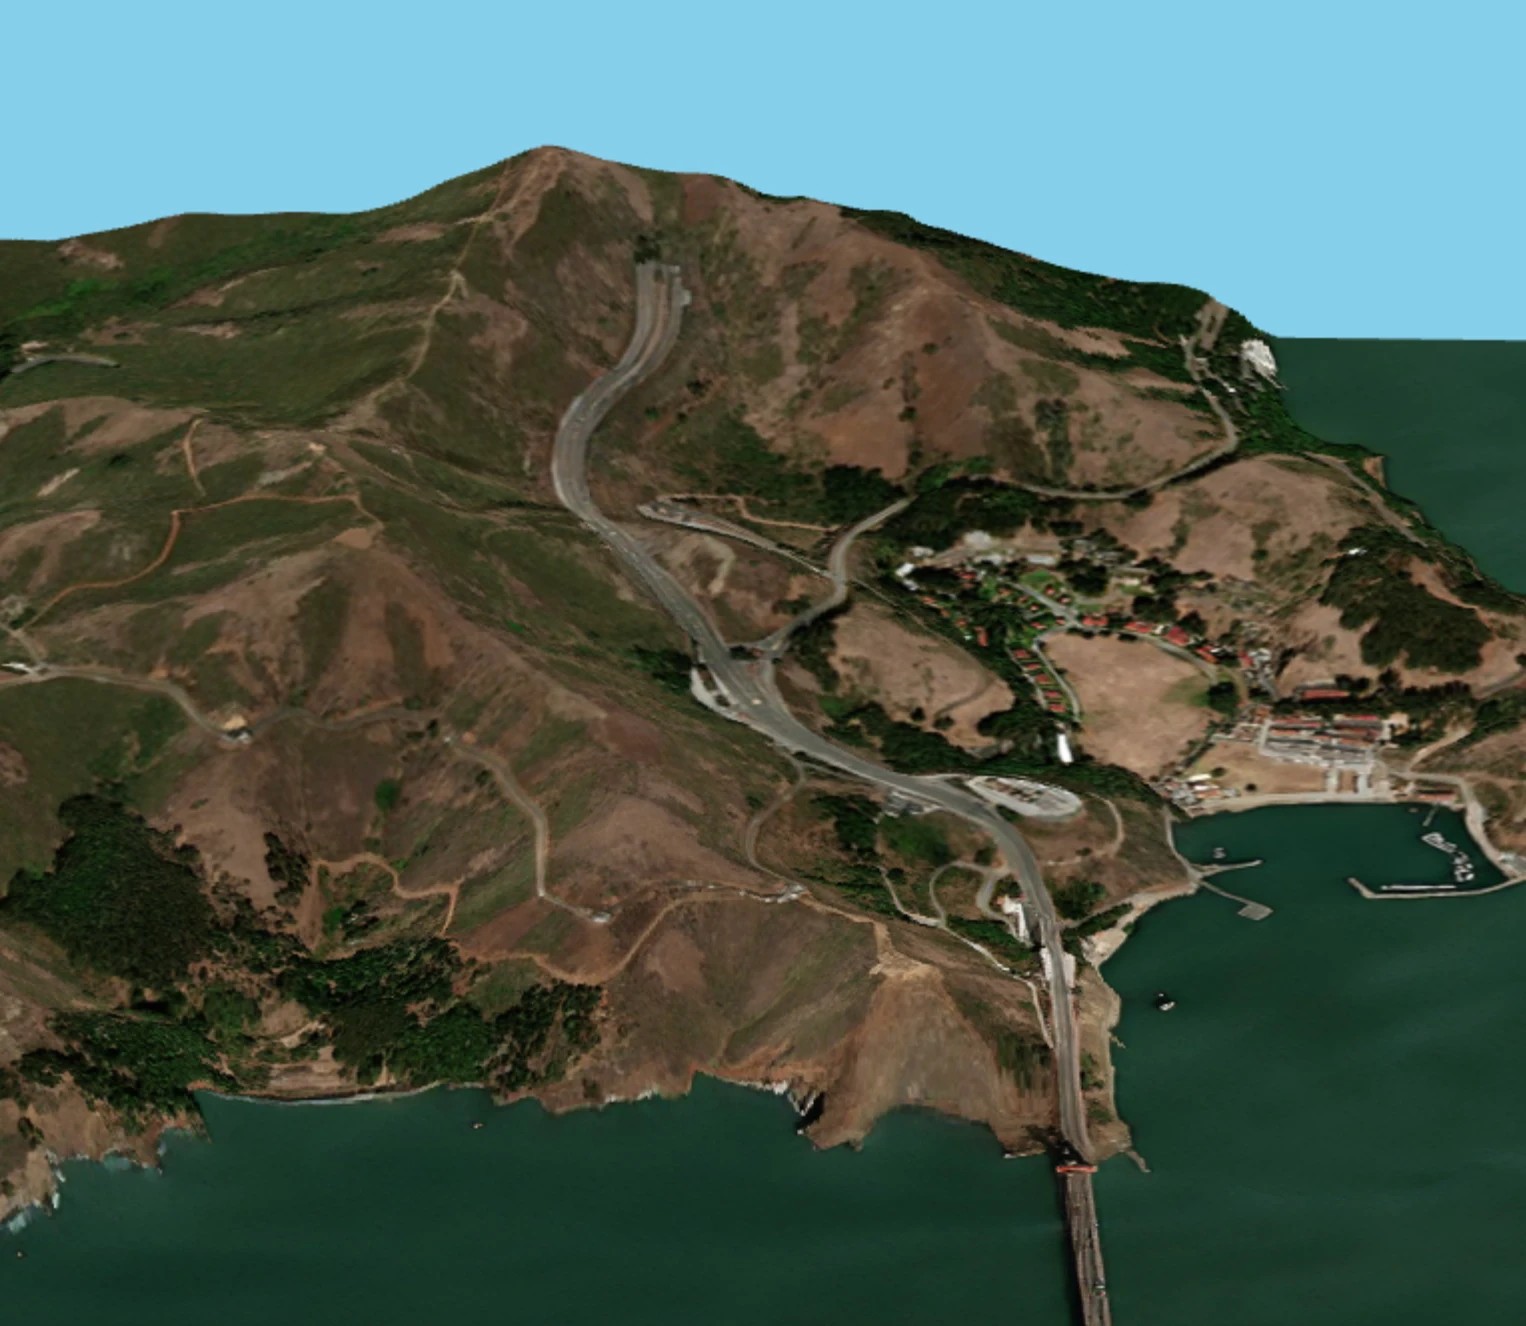
Worldwide DSM at 3m grid posting (often resampled to 1m), 0.5–1m absolute vertical accuracy in most locations, circa 2015.
Digital elevation maps include the Digital Surface Model (DSM) and the Digital Terrain Model (DTM), which is built on the DSM. Note EarthToDate only provides DSM at this time.


Upload your own scene — ×2 or ×4 enhancement, your choice at the same price, or PlanetScope 1.9m — from satellites, aerial and drone visual images.
EarthToDate is using faithful reconstruction using physics and machine learning sharpening to recover hidden details and add clarity to all sensors, including satellites, aerial and drone visual images.
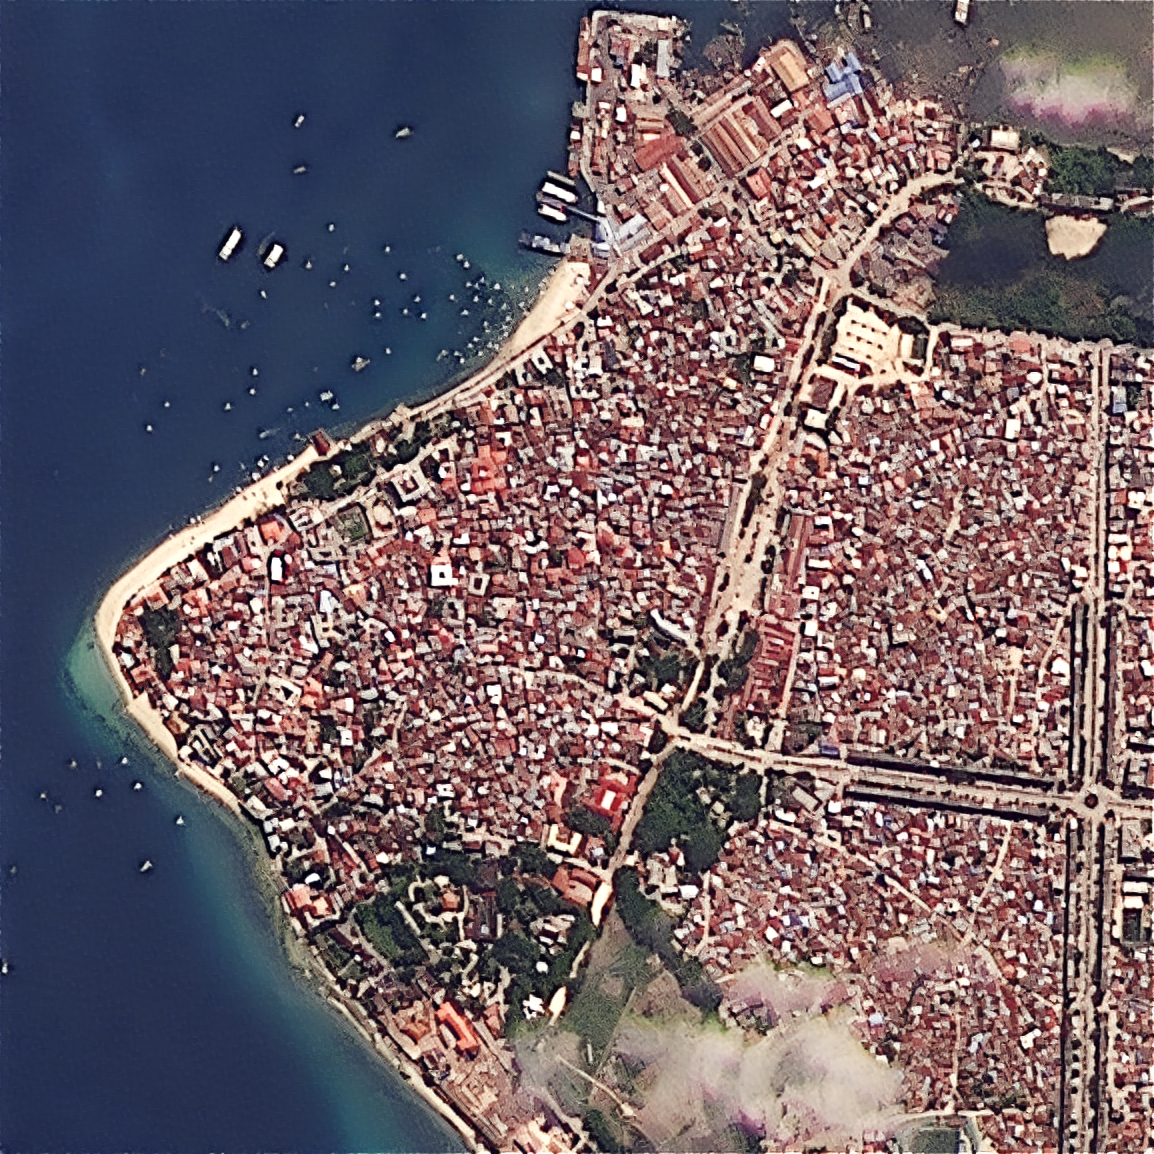
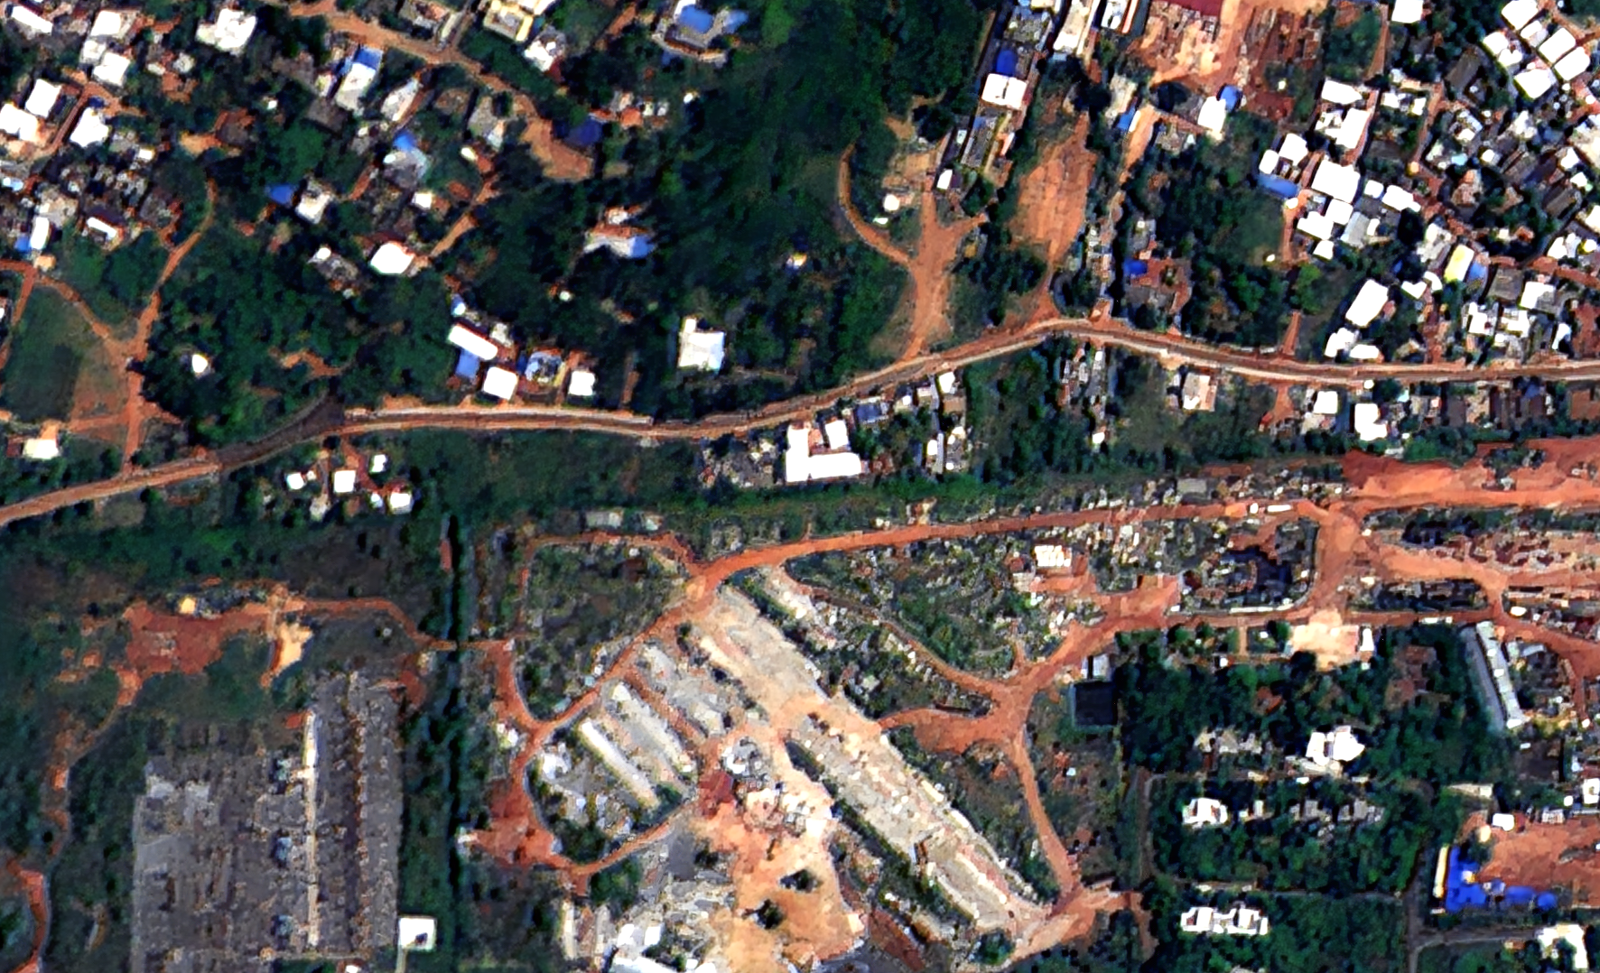
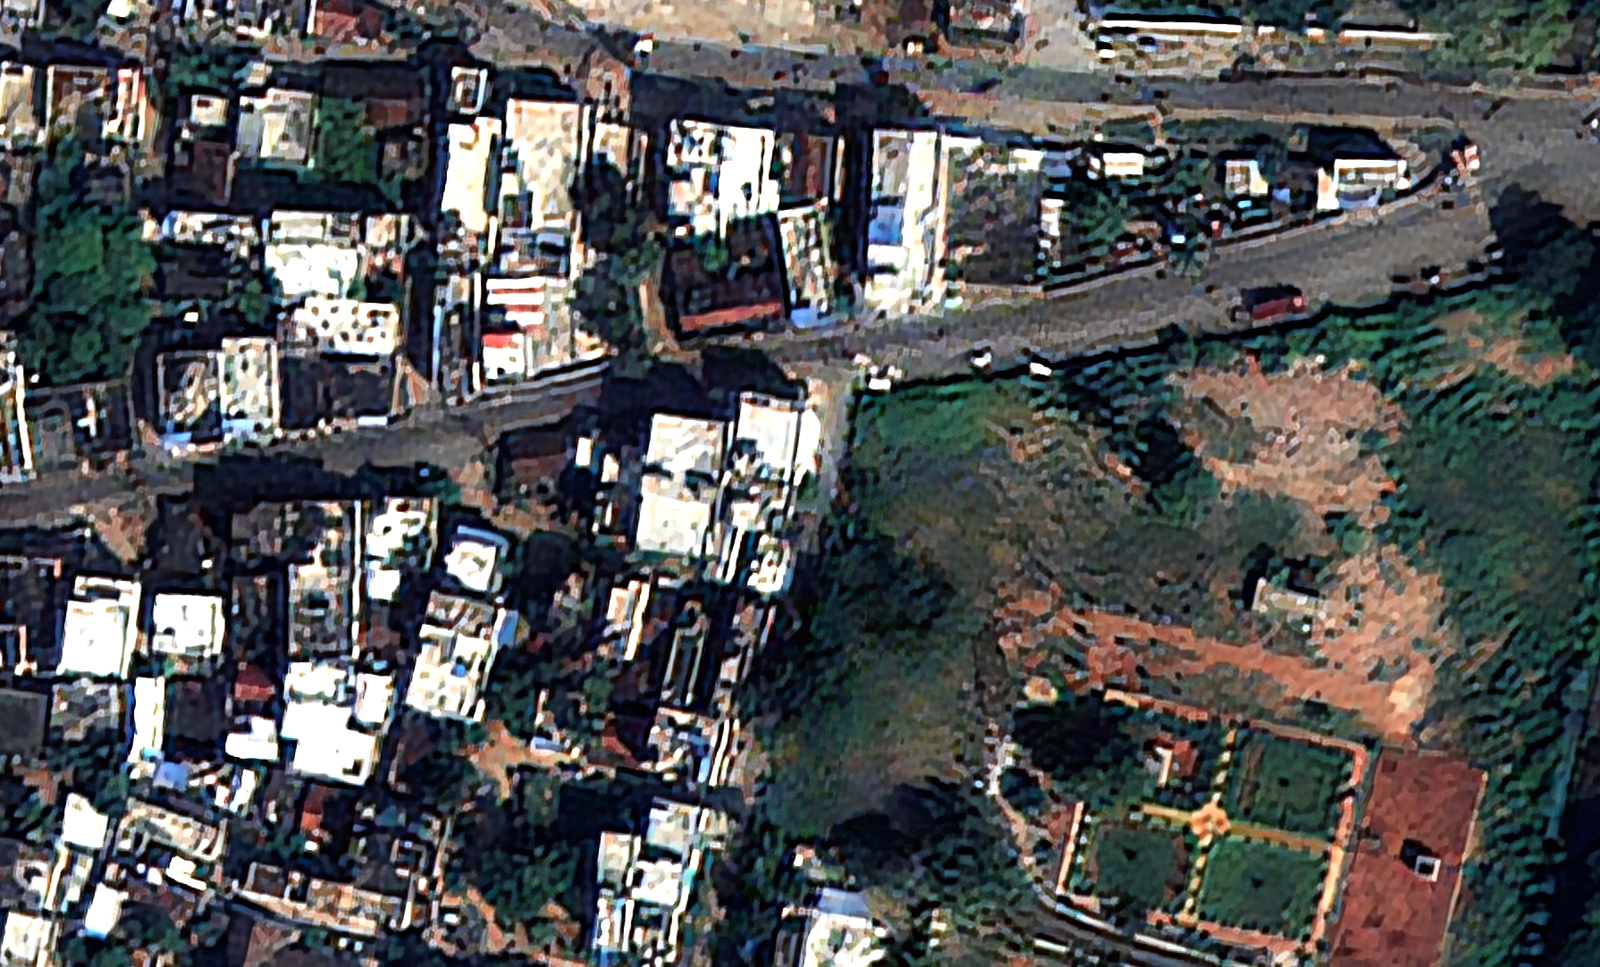
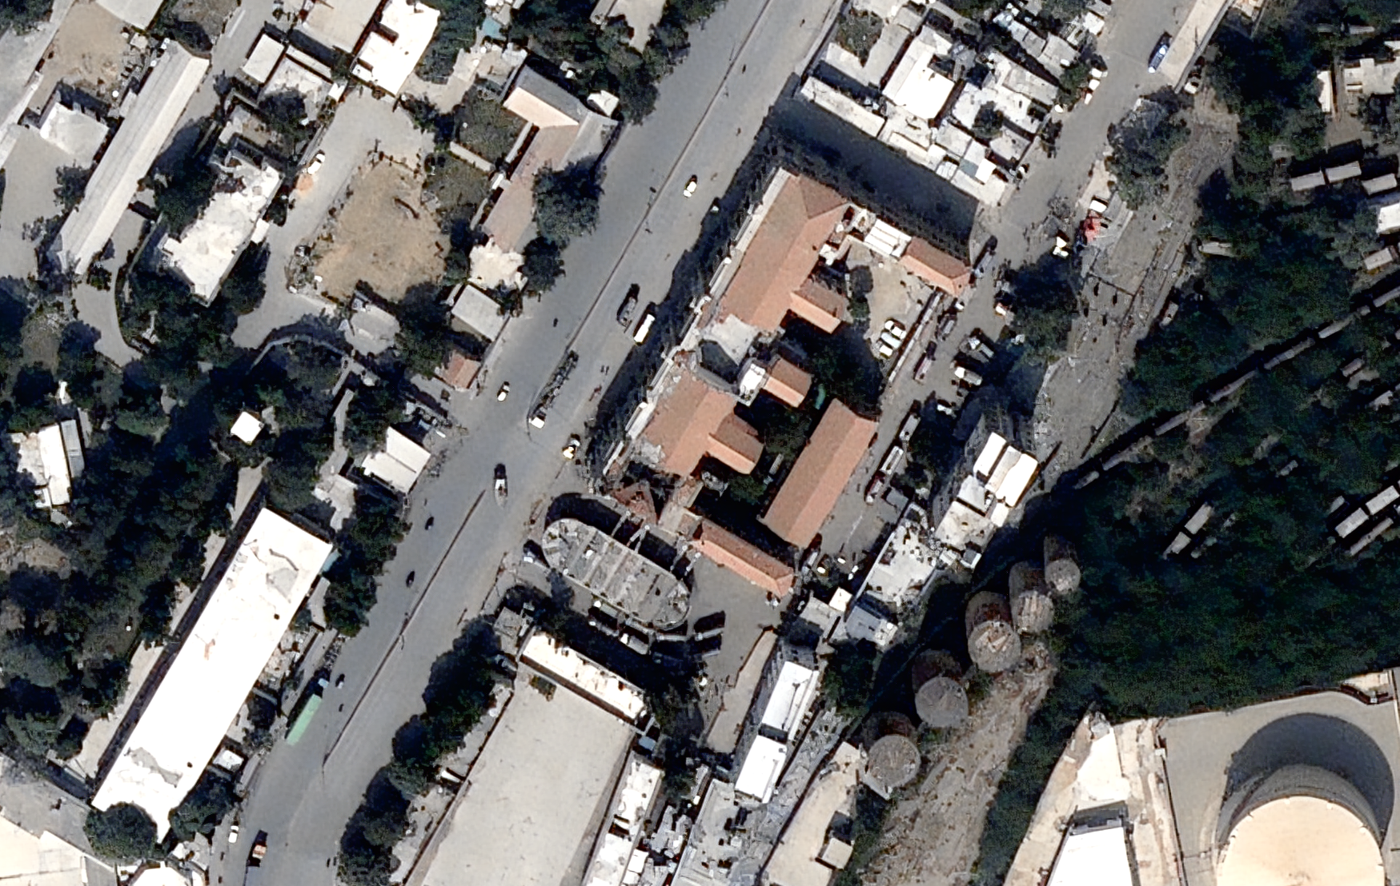
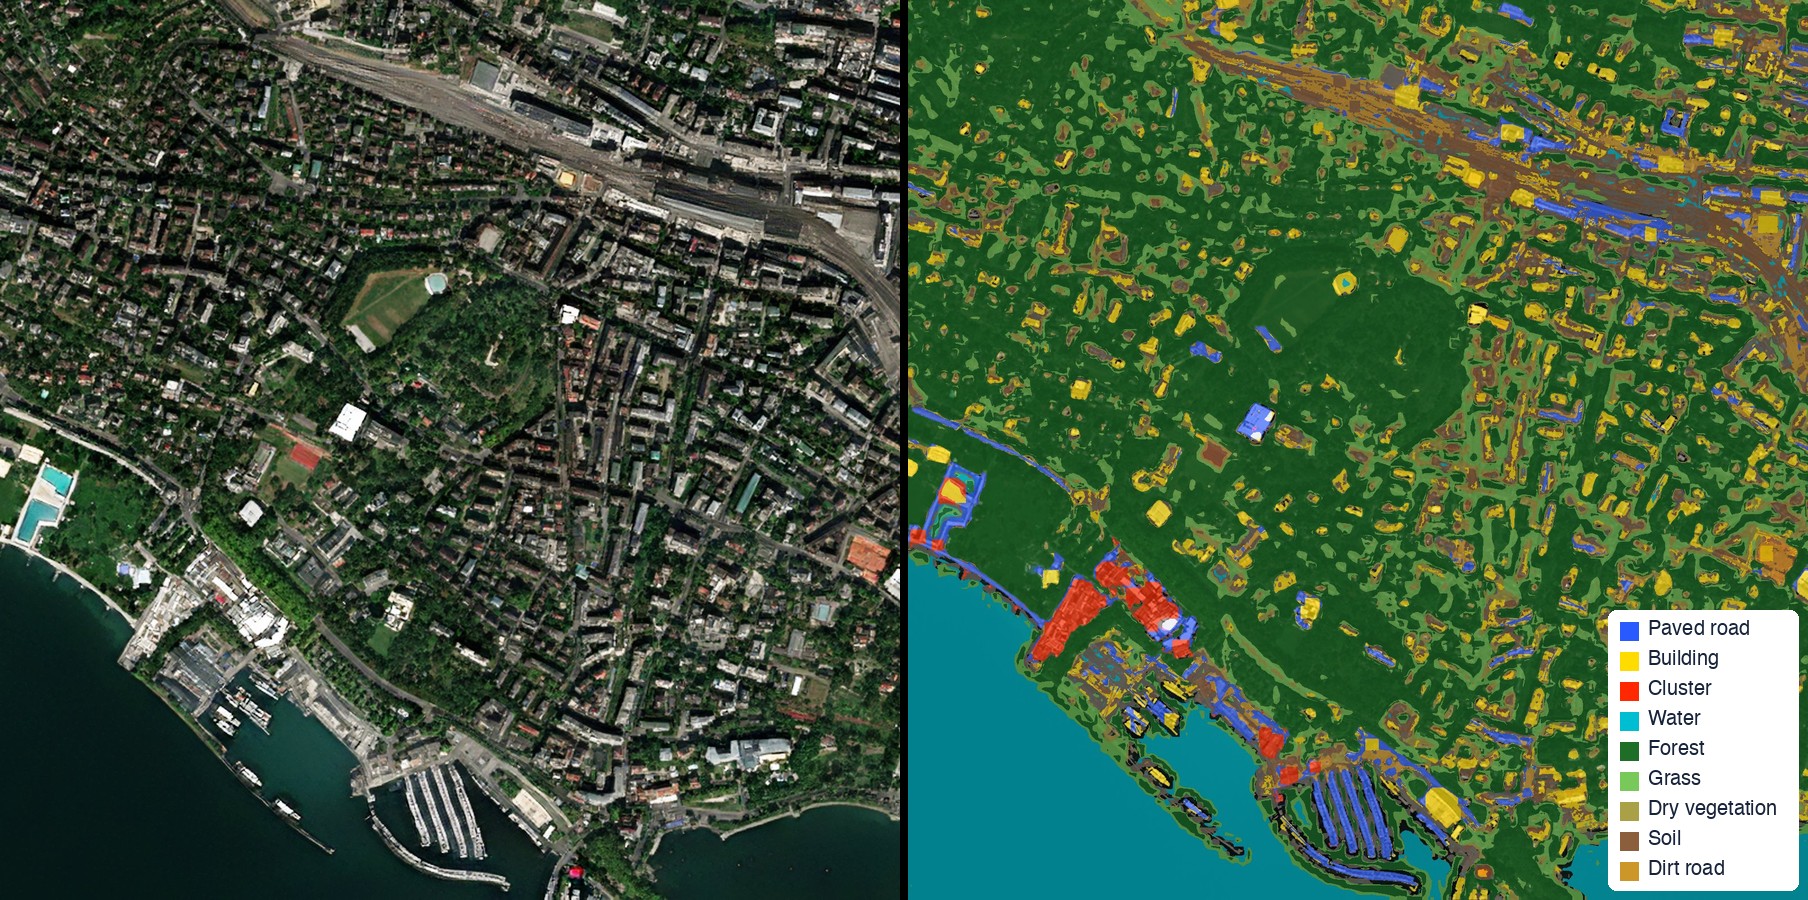
Bi-weekly land cover classification of any area size at 2m GSD and 1m visualization — buildings, roads, water, forest, vegetation, soil, greenhouses and more.
A wide range of uses requires identifying how different areas are being used past and present, such as water bodies, constructed areas, forests, and more. The change of areas is the basis of some uses, such as new construction and deforestation detection.
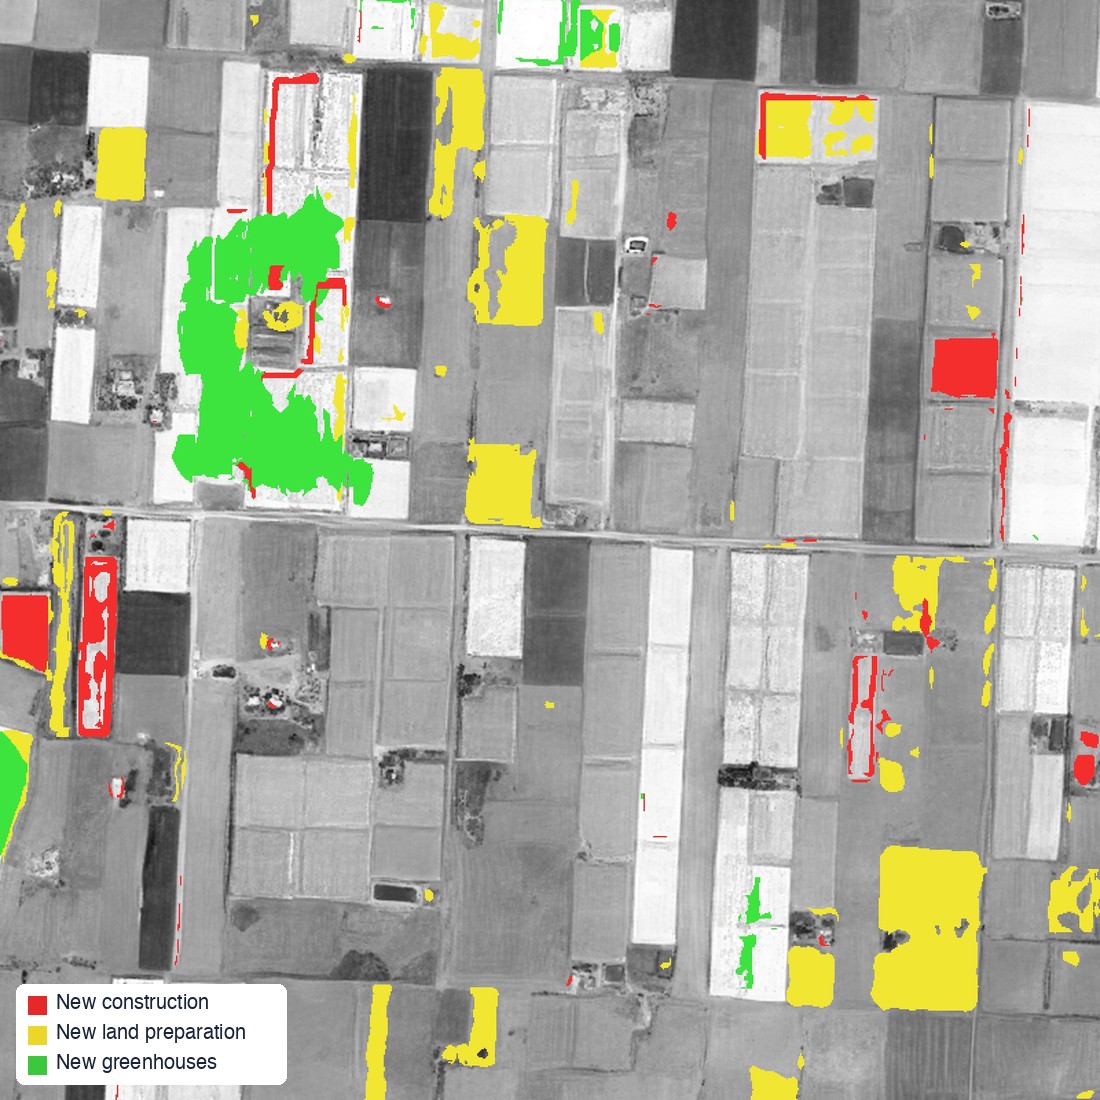
New construction, greenhouses, land preparation and reclaimed land labelled between any two dates at 2m GSD.
New construction identification is a concern for many, including municipalities, national agencies and NGOs, and domain-specific organizations such as utilities and defense. New construction may be legal and tracking it serves needs such as urban sprawl, or illegal and serves needs such as tax and registration conformance.
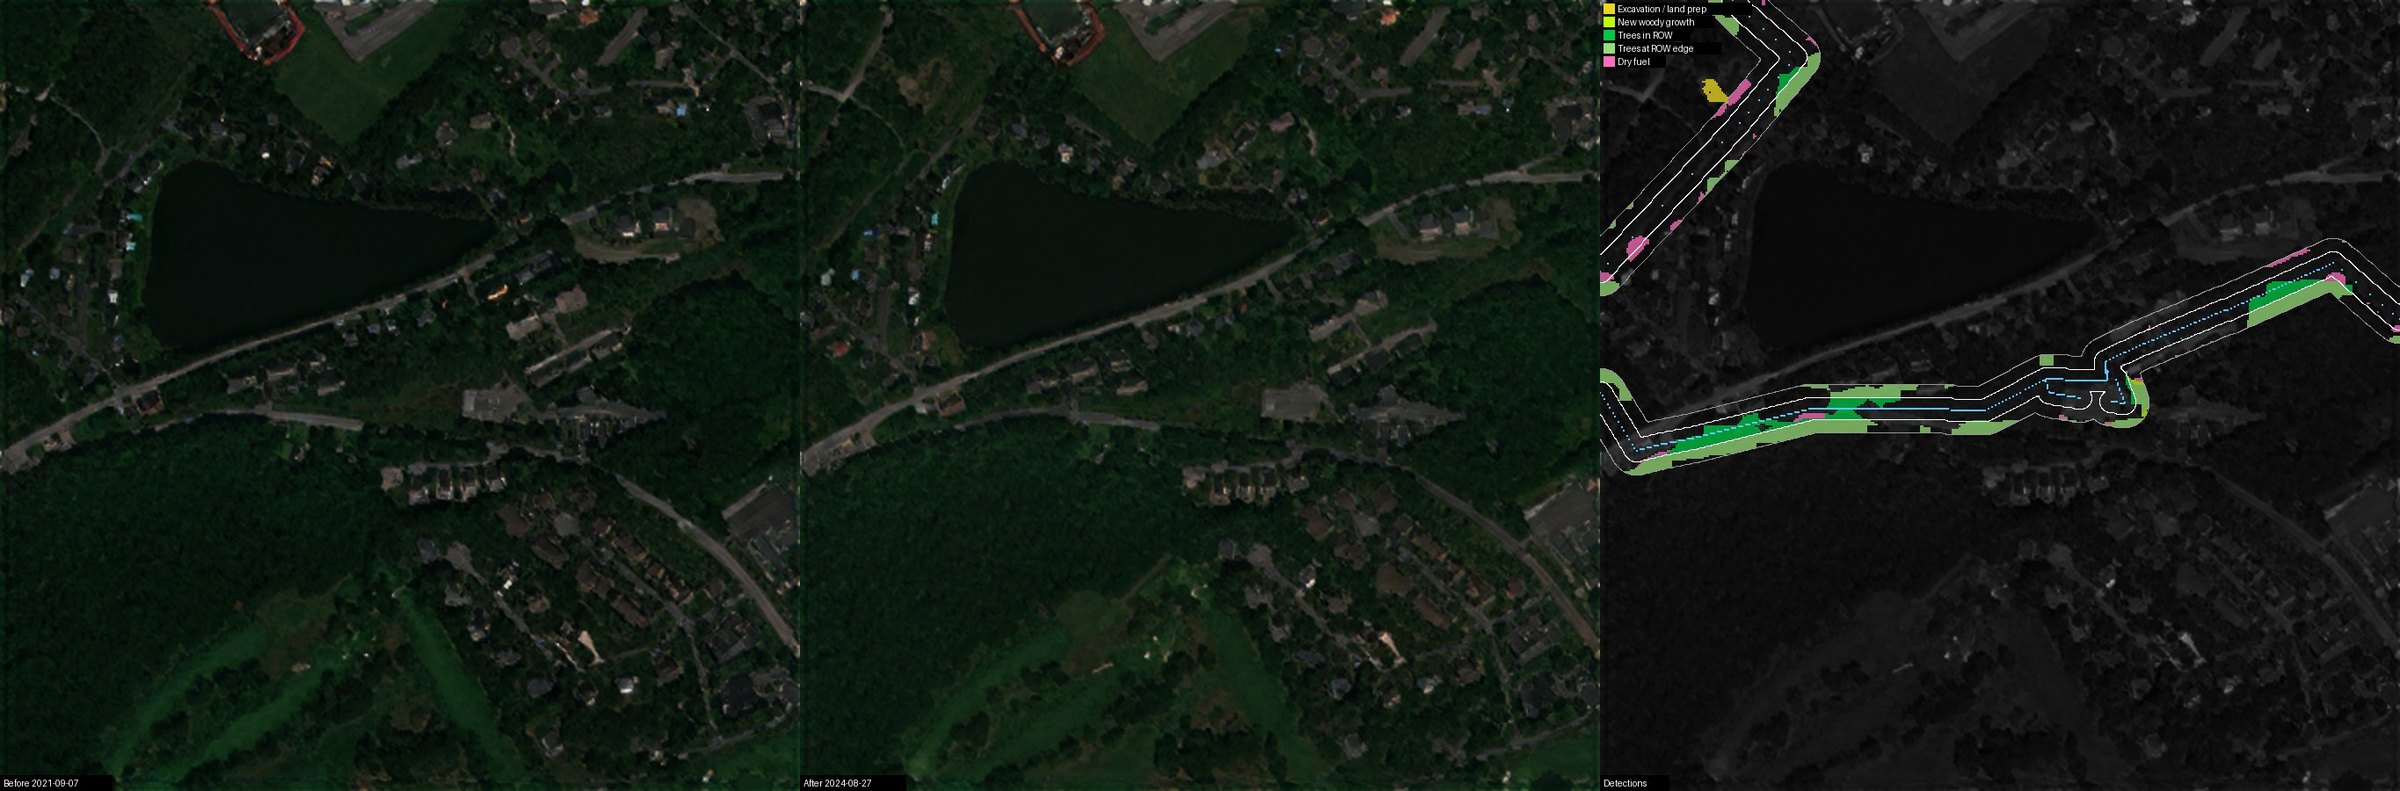
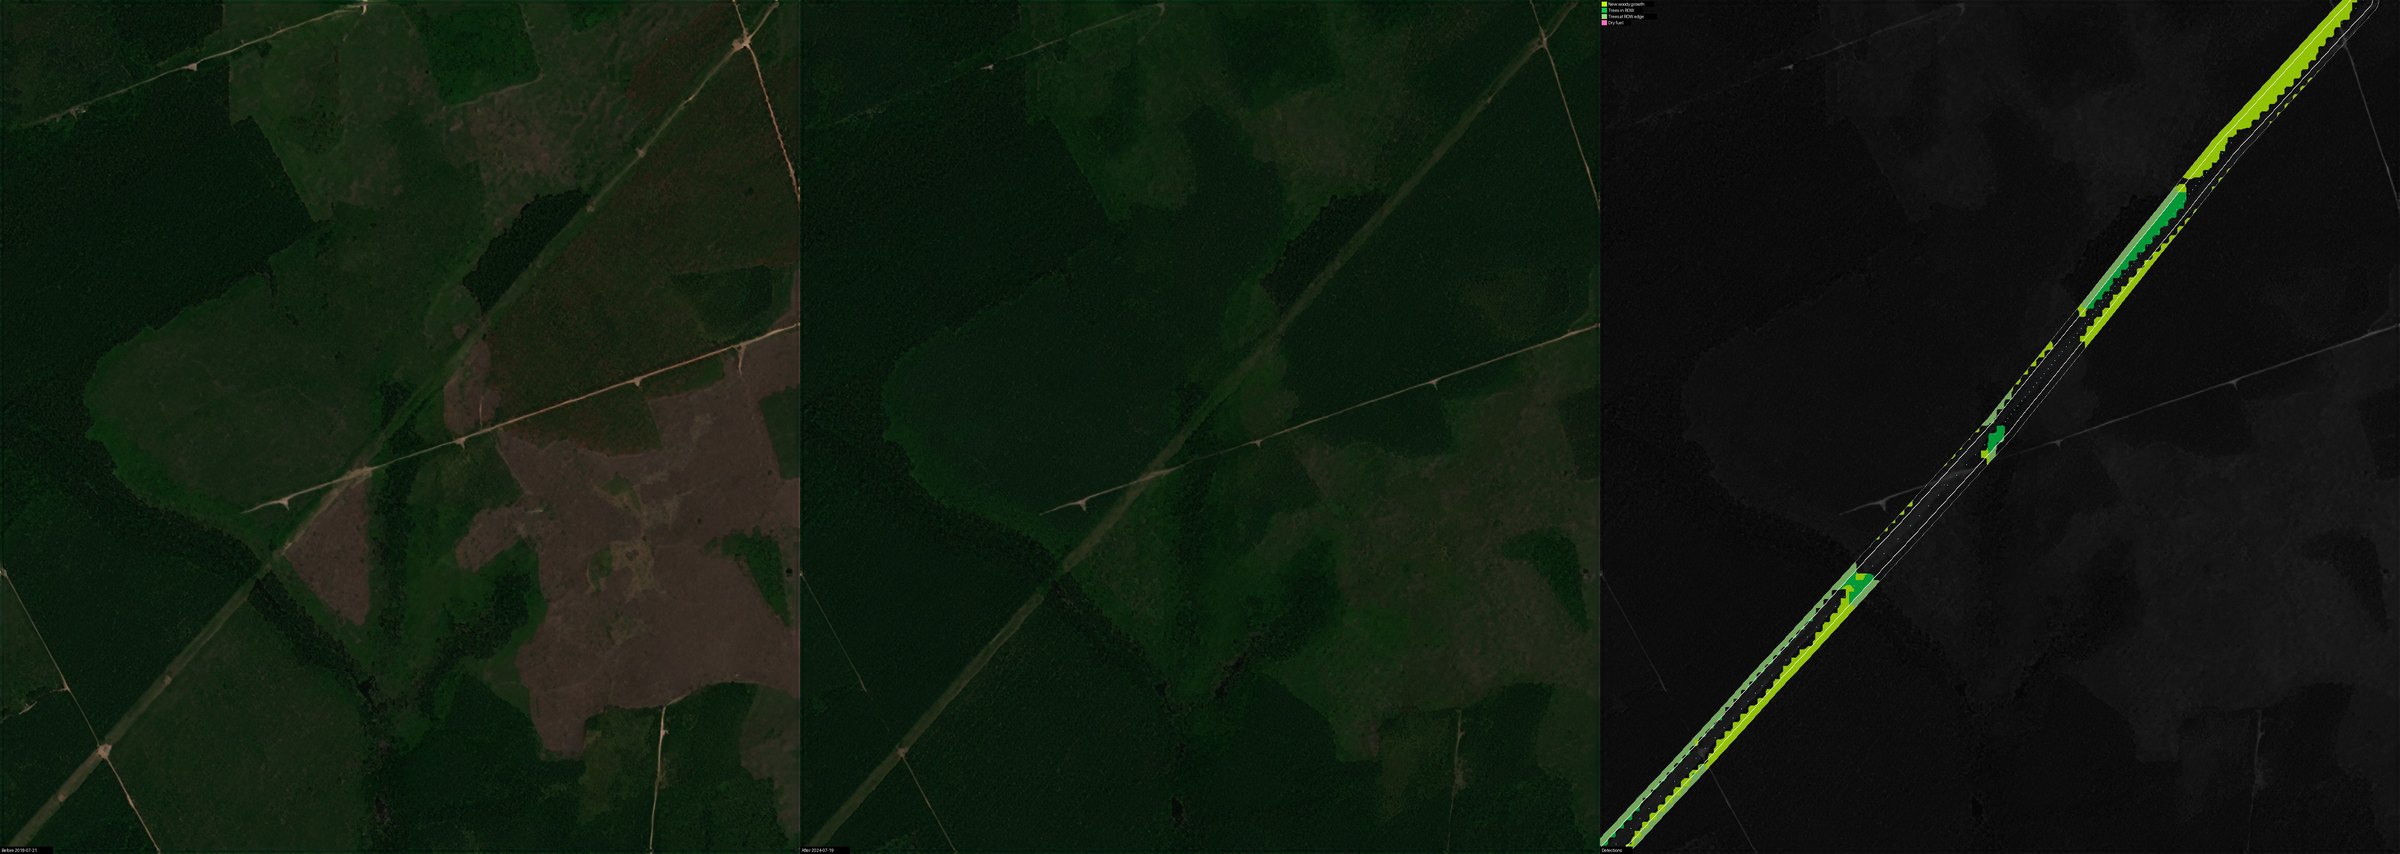
Monitoring of corridors and key sites — railroads, highways, pipelines, power lines, ports and more — for new construction, vegetation encroachment, floods, fires and slides.
Corridor monitoring is the responsibility of many organizations owning a pathway along significant stretches, most of which have Right of Way (ROW) over their corridor. Critical site monitoring has a similar responsibility over a large number of isolated installations.
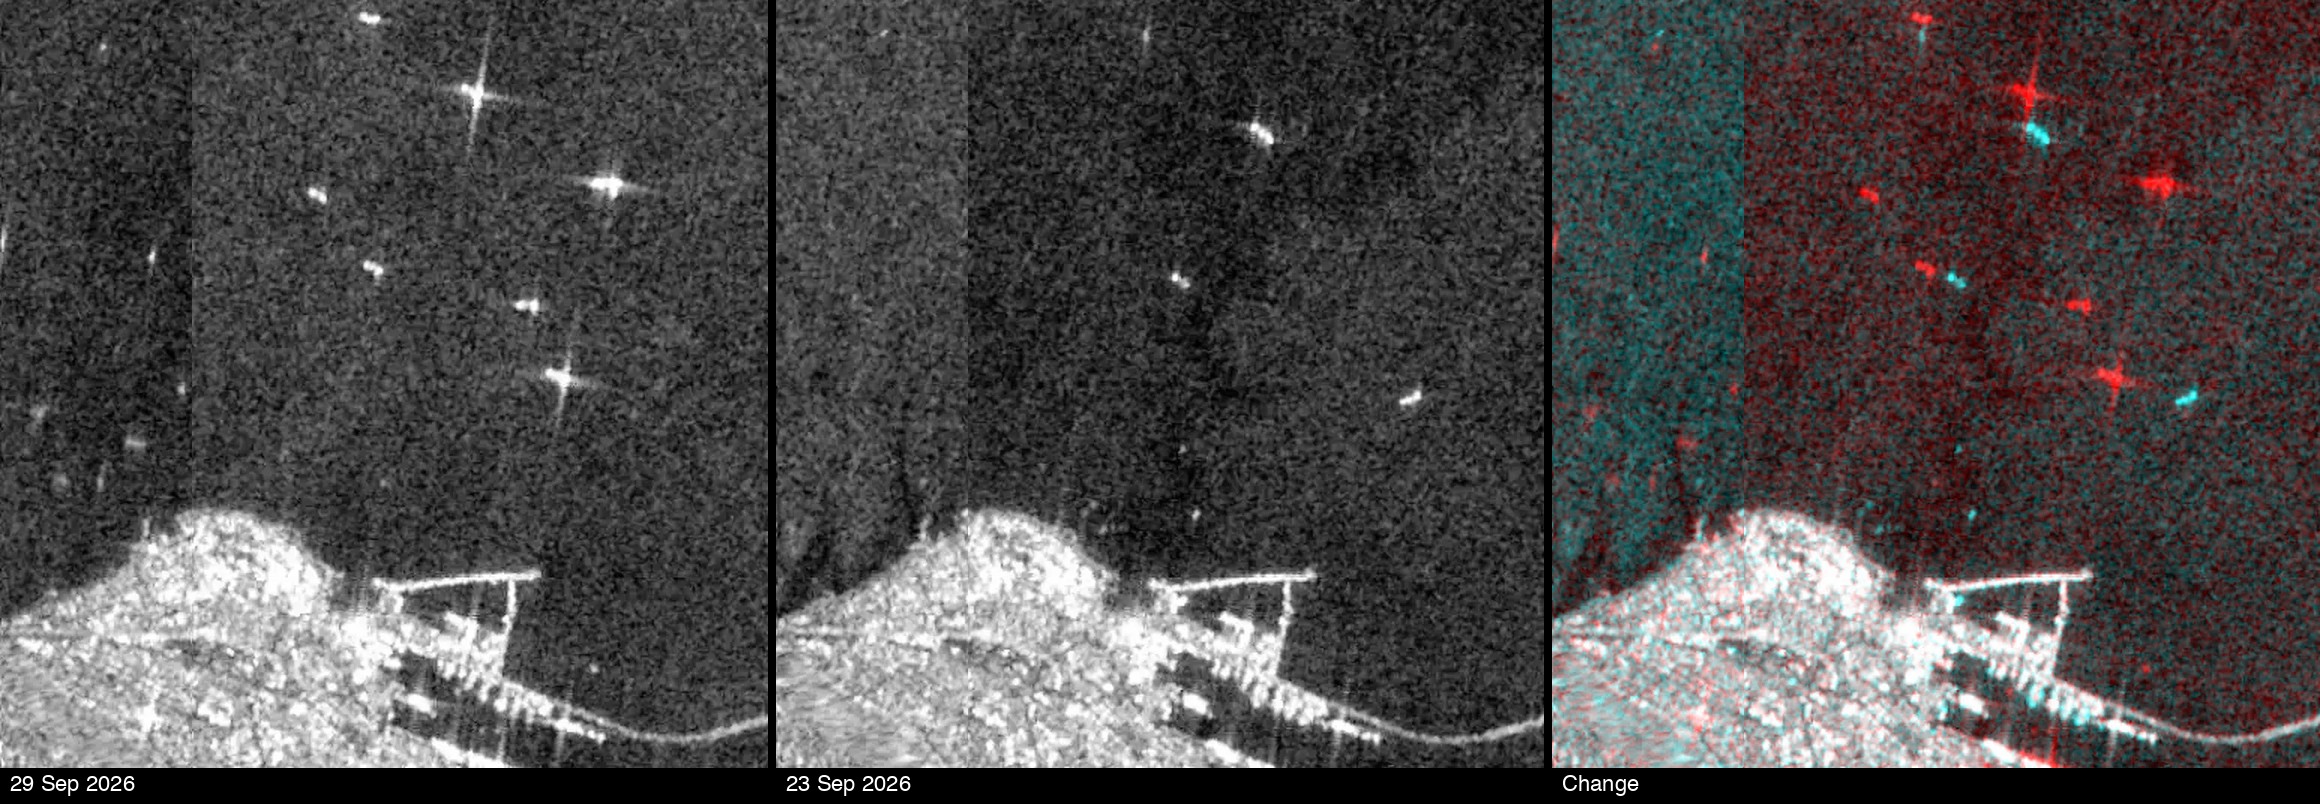
Worldwide reported ship identity, location, heading and speed over the last 14 days on basemaps; coming up: matching ships seen in SAR, including dark ships.
AIS (Automatic Identification System) is an international standard under which ships are required to frequently broadcast their identity, location, heading and speed.
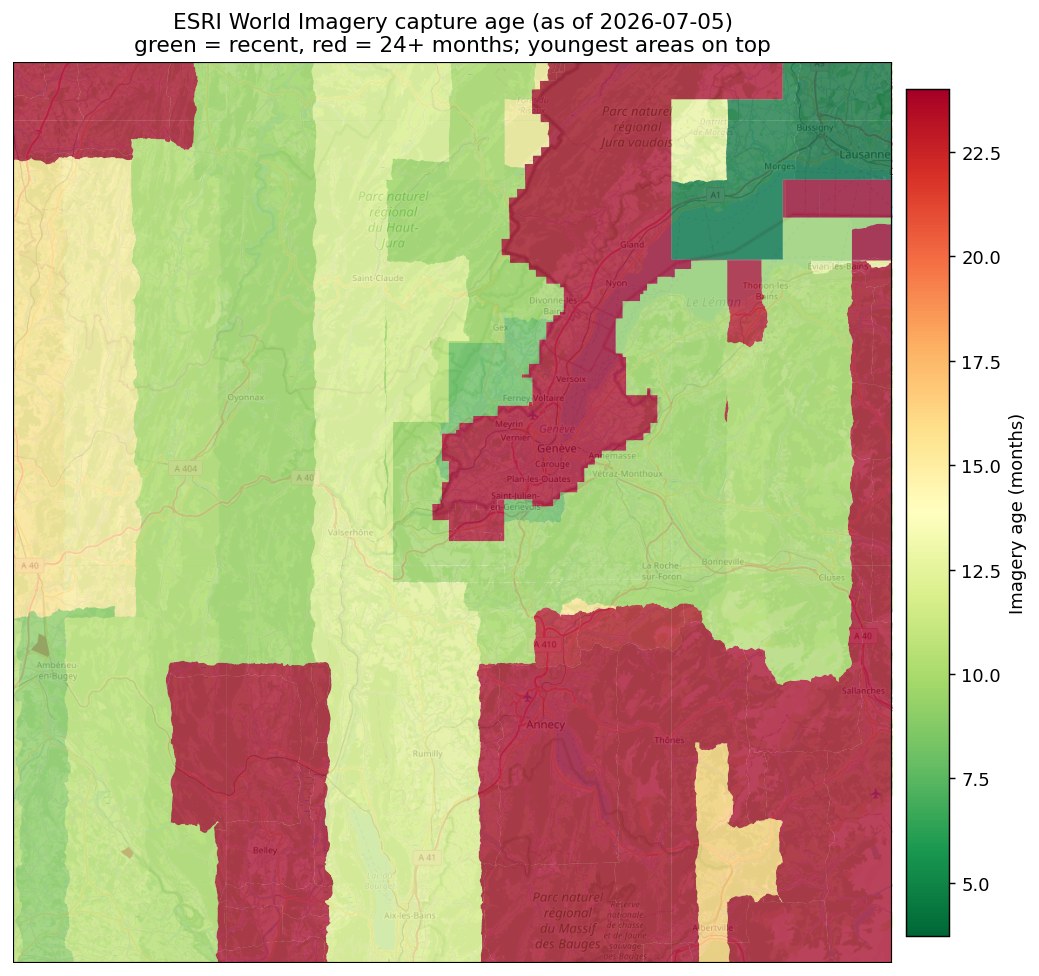
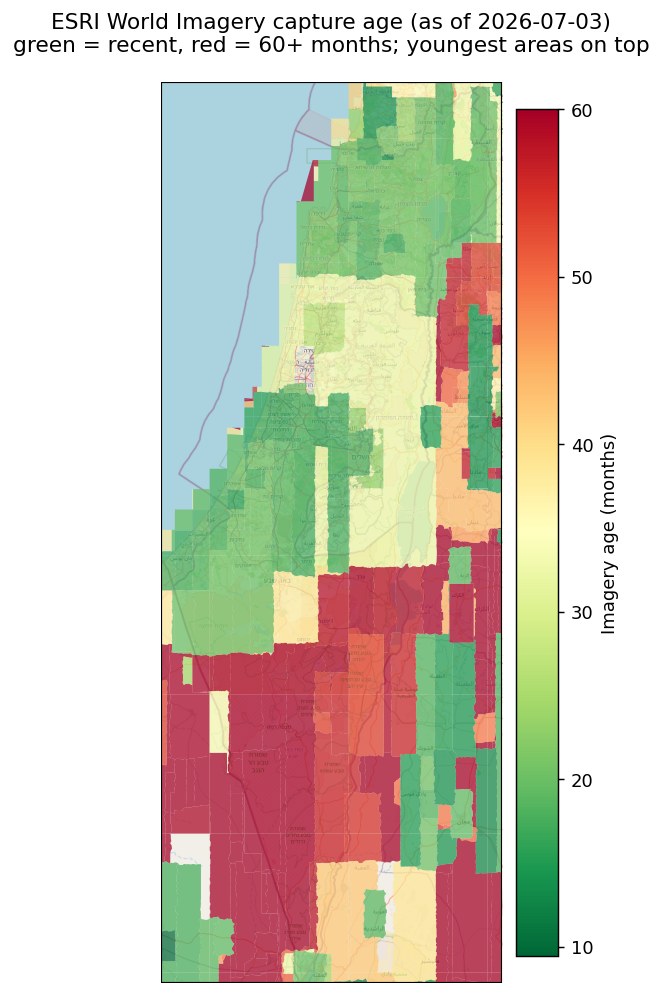
An age map of ESRI World Imagery, so users know how current the imagery is for their use case; a fused up-to-date version is coming soon.
ESRI has licensed various satellite imagery sources, most notably the Vantor (formerly Maxar) Vivid basemap, and provides it as ESRI World Imagery: 0.3m in select metropolitan areas, 0.5m across the United States and parts of Western Europe, and 1m elsewhere.
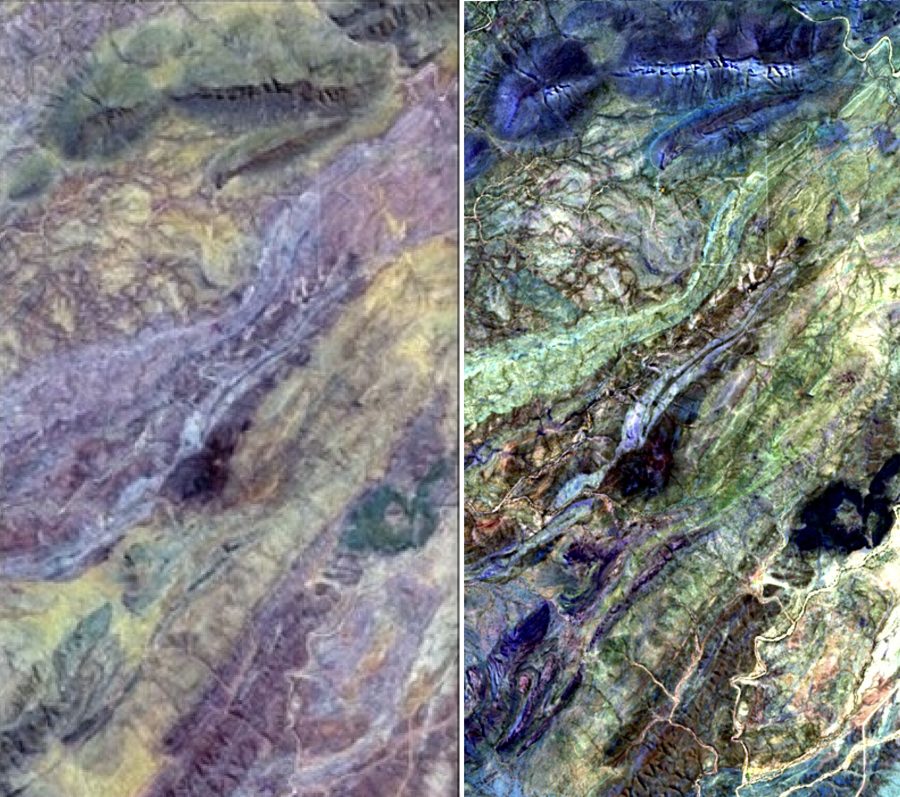
Hydrothermal alteration mapping at 2–4m from enhanced Sentinel-2 — four alteration indices, a composite score and a 7-class map; a sub-5m SWIR source since WorldView-3 retired.
Surface mineral mapping finds exposed rock and soil whose spectral signature points to hydrothermal alteration — the surface footprint of many buried ore deposits — and is the basis of exploration targeting before drilling.
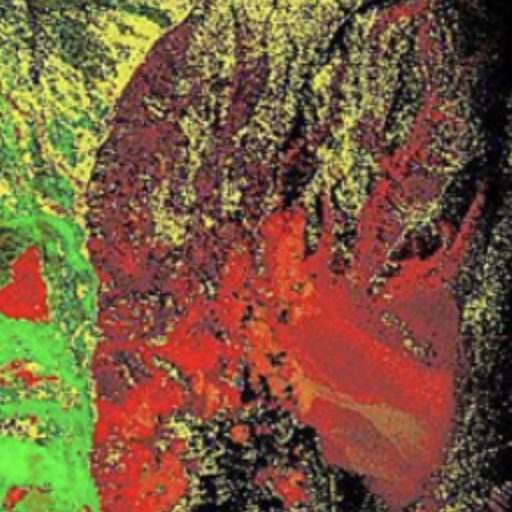
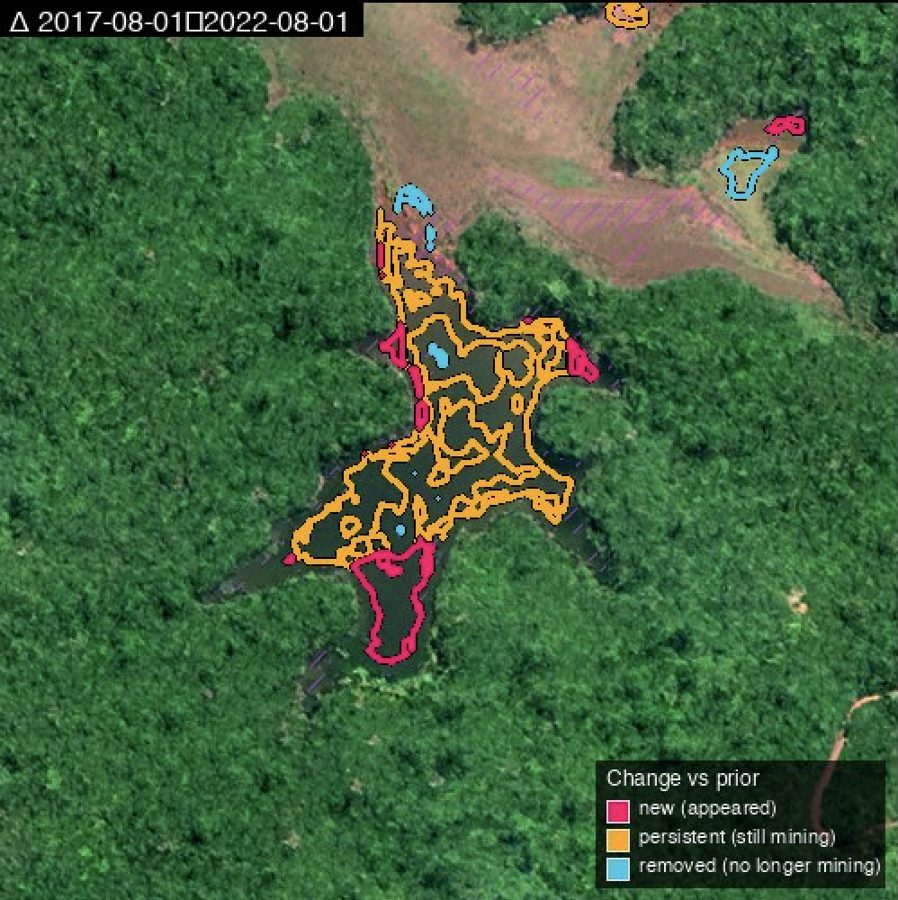
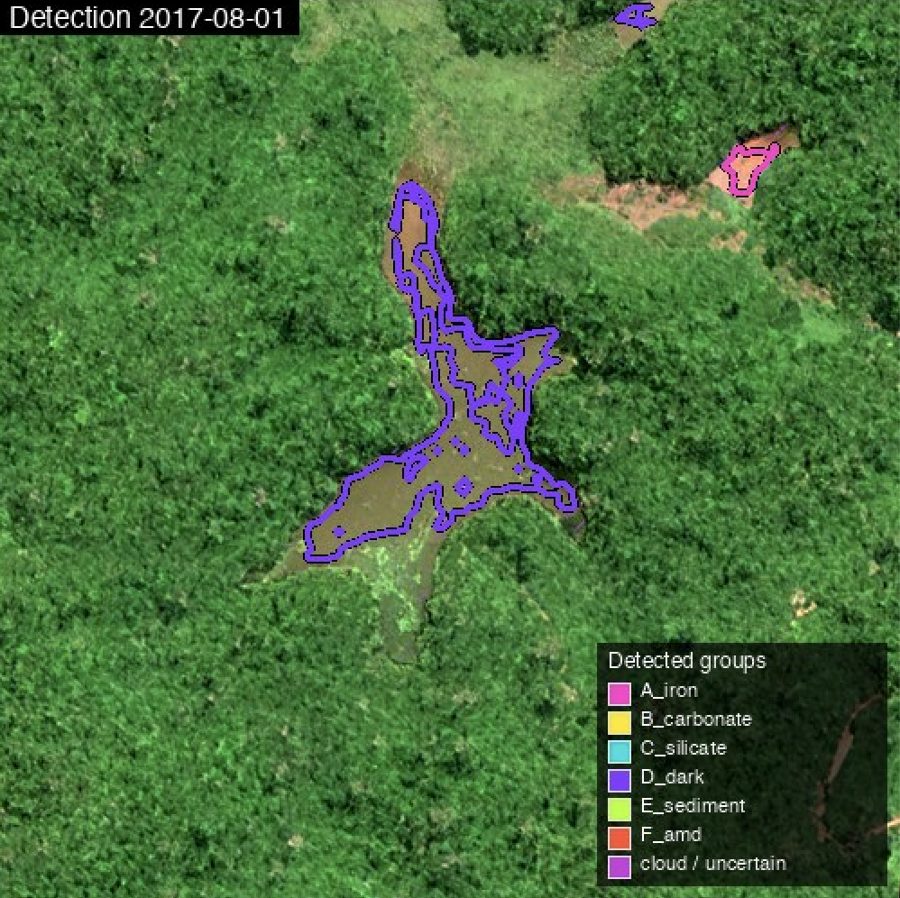
Monitoring of licensed and illegal mining, including small artisanal sites, for governments, operators and NGOs.
Mining is conducted at scale in many countries, licensed and illegal, often in remote places. When illegal, operations are usually artisanal, small and hard to identify. Mining monitoring is used for various purposes:
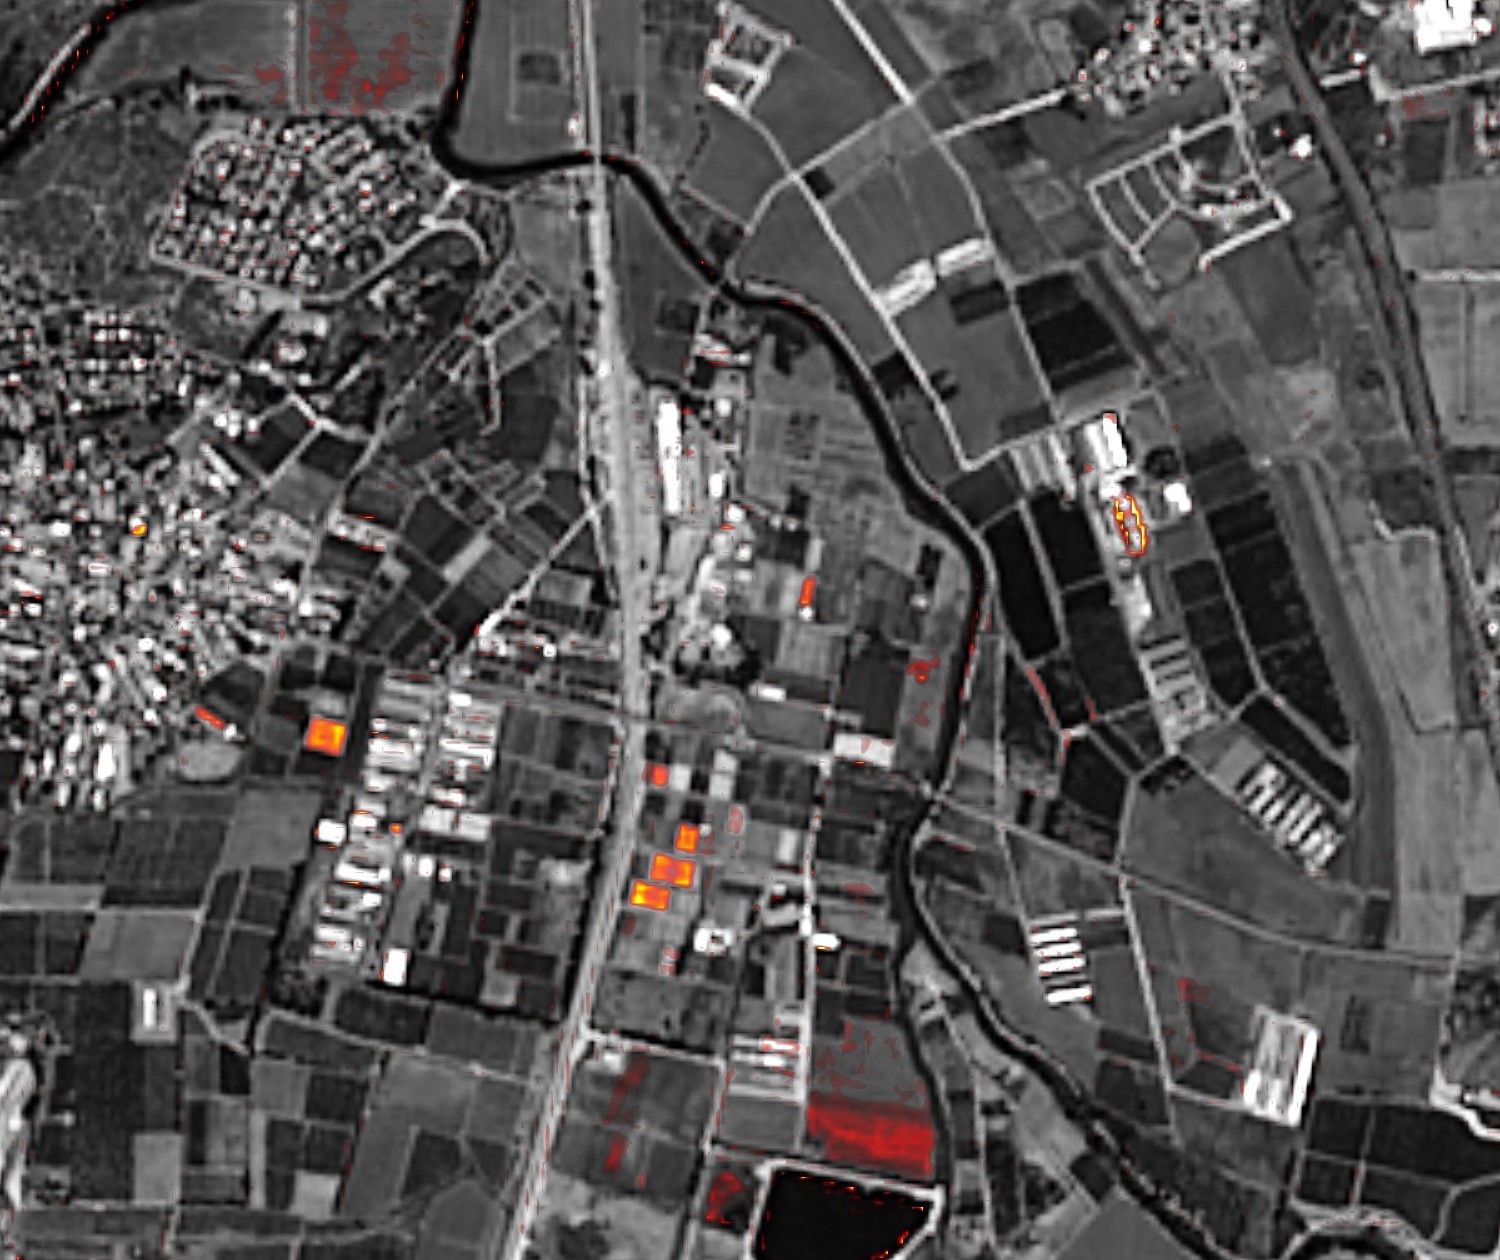
National-scale continuous warning of suspected underground water leaks, from local soil moisture increase in 2m multispectral data.
Water utilities lose about a third of the water they supply before it reaches users — an average of 35% in urban systems, about 126 billion m³ a year worldwide. Various methods are employed, such as water pressure sensors, but the problem is still very much present.
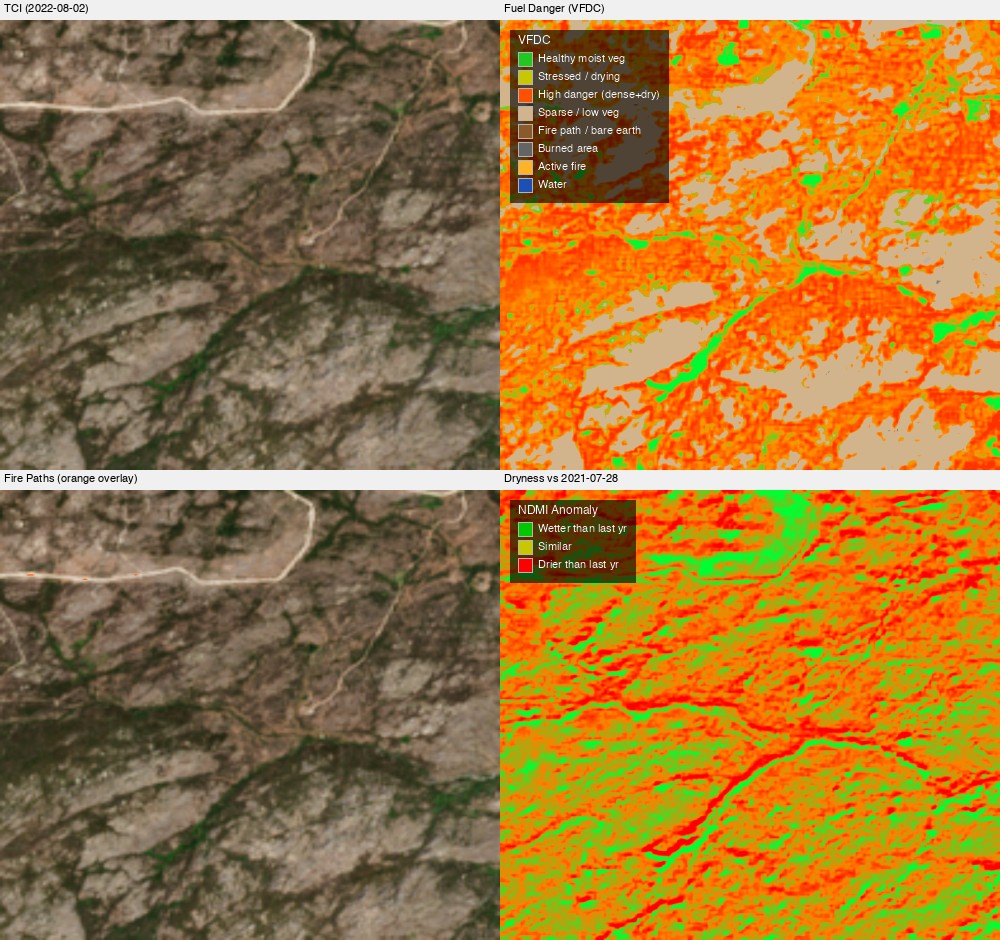
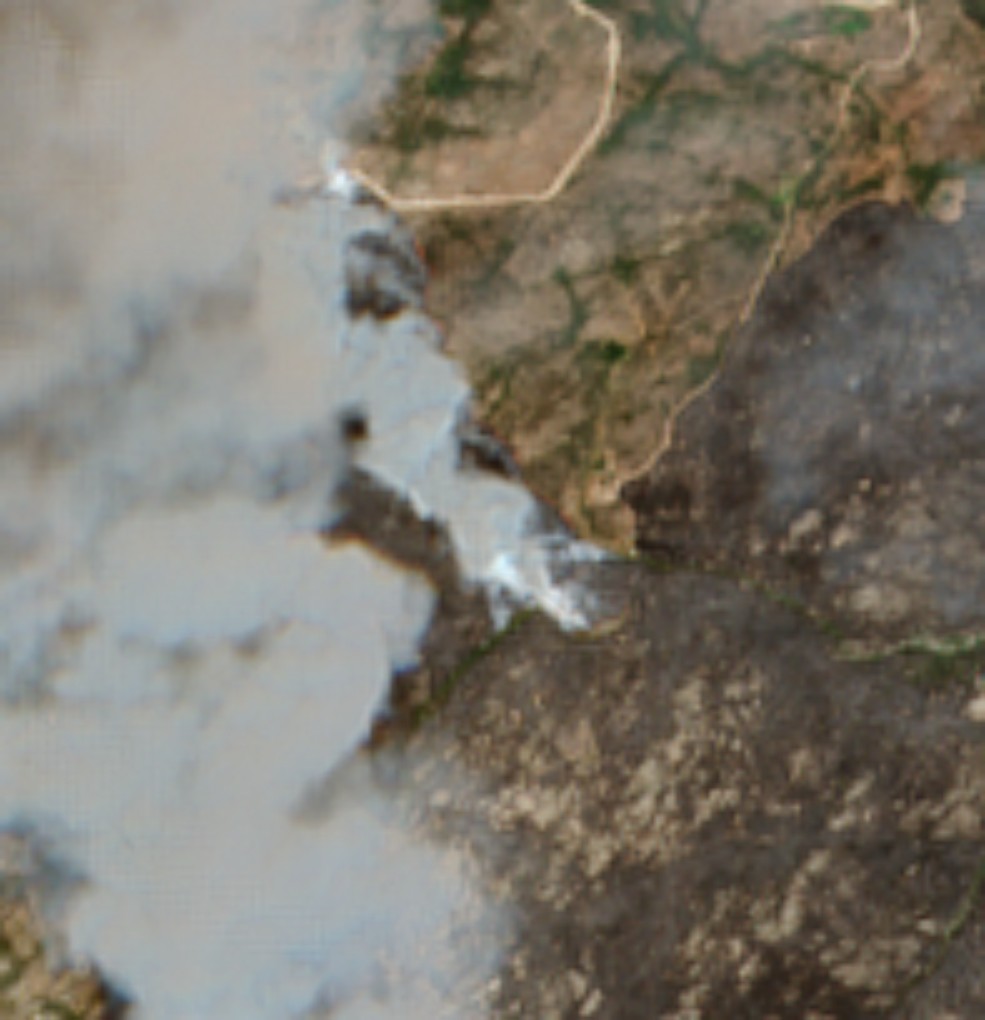
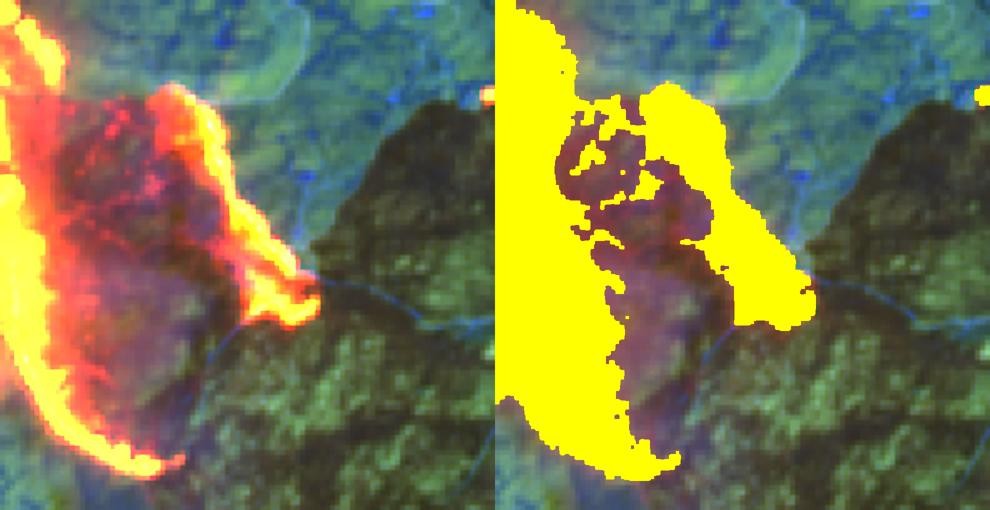
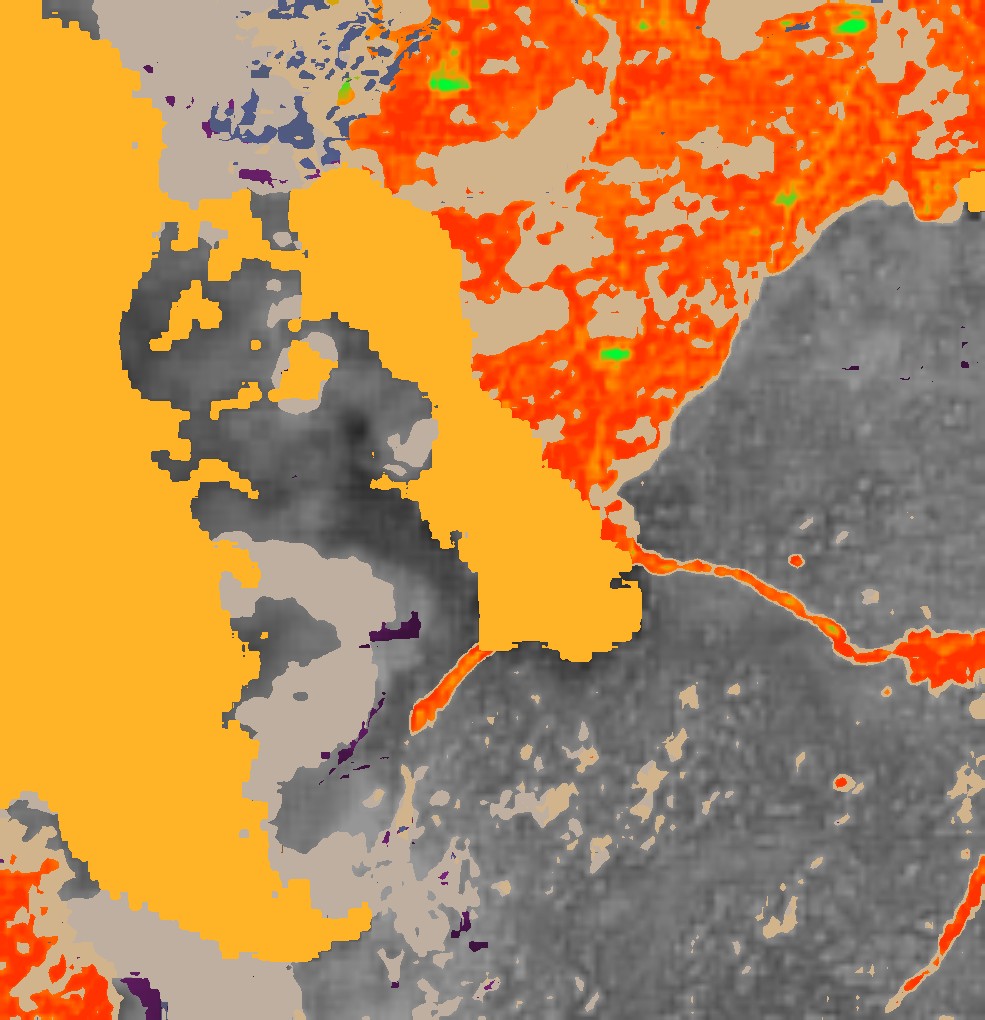
End-to-end fire hazard analysis — vegetation dryness, firebreaks, active fire through smoke, baked ground, post-fire debris flow and recovery time.
Many locations have ongoing concerns regarding managing fire hazard. The issue is primarily created by dry vegetation, and a major countermeasure is firebreaks. This obviously affects different locations at different times of the year.
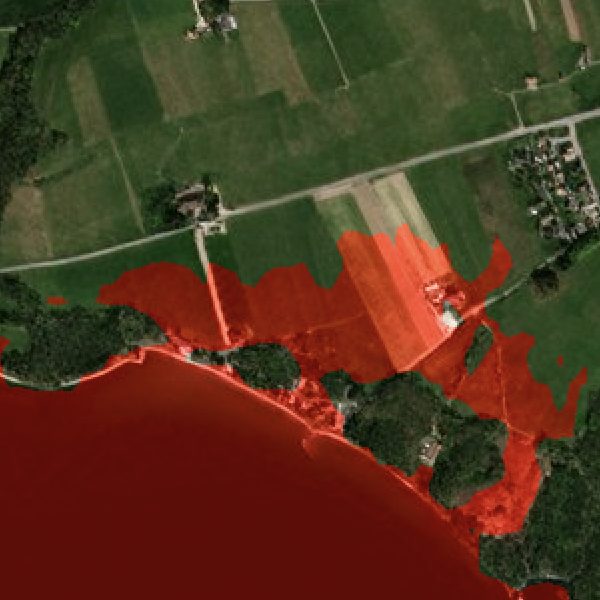
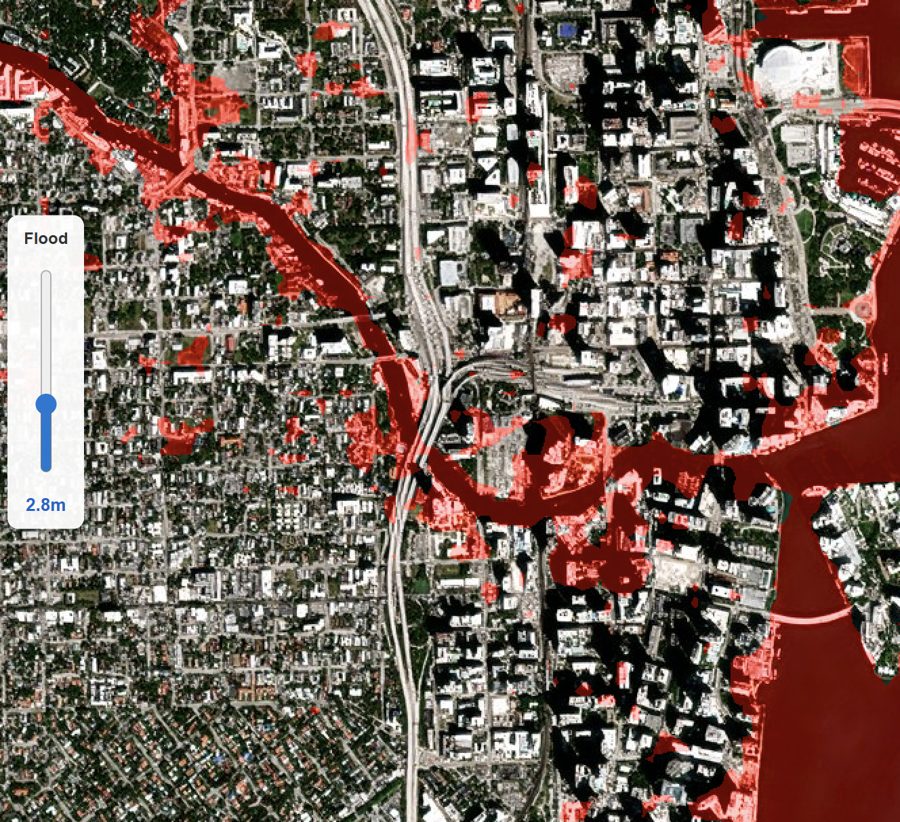
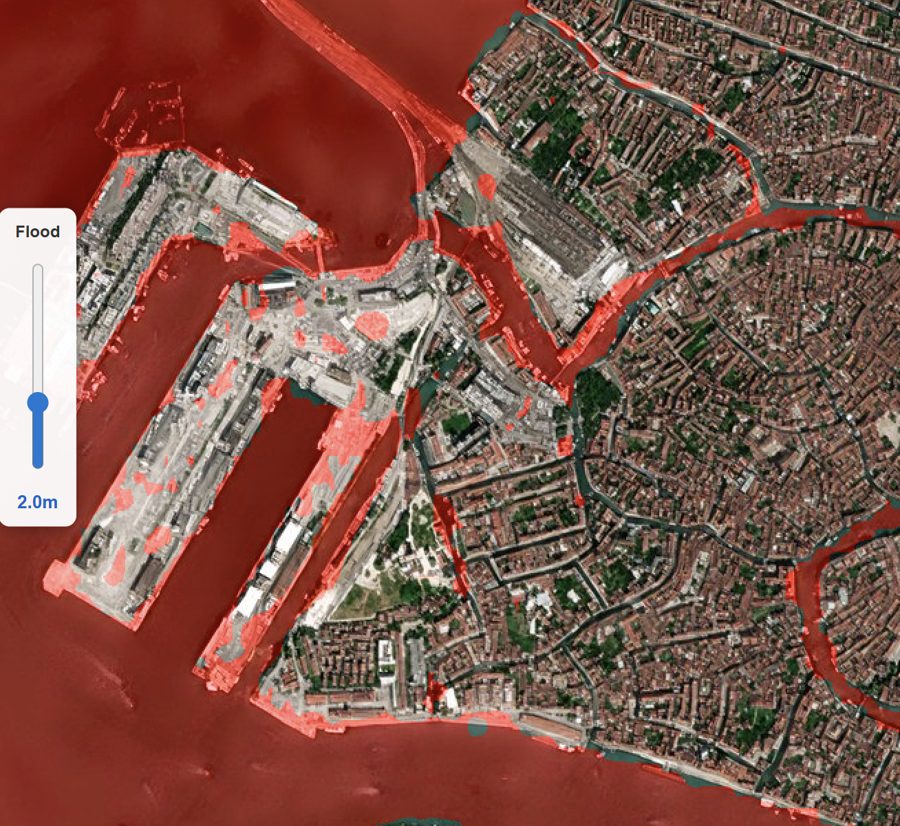
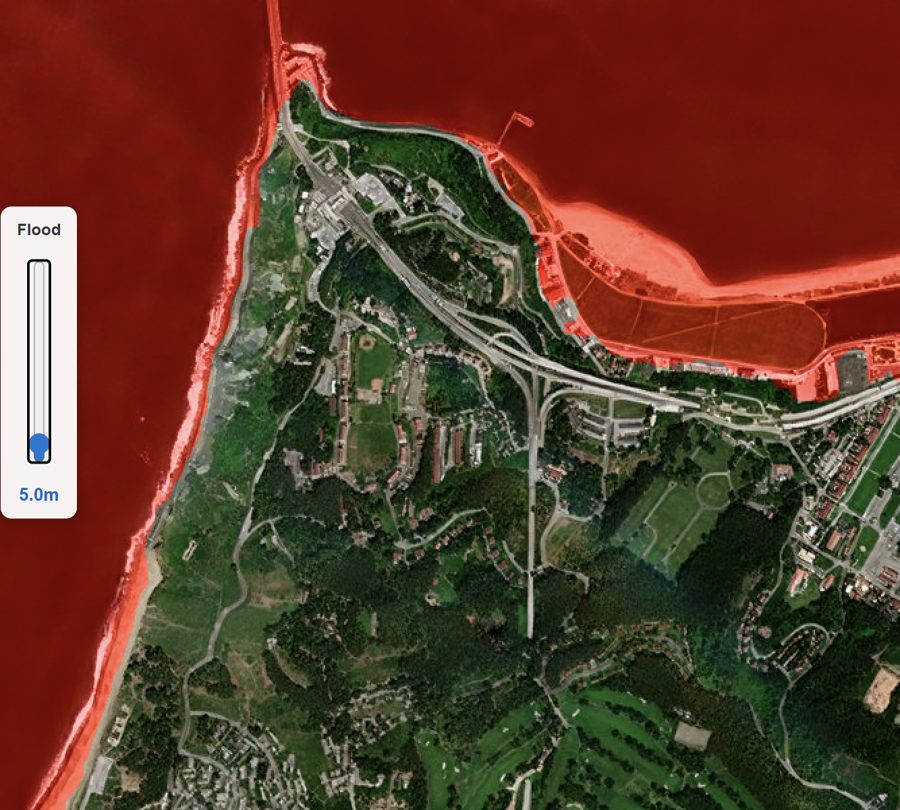
Simulate floods from seas, lakes, rivers and streams on a worldwide elevation map with 0.5–1m vertical accuracy.
Potential floods from water bodies like seas and lakes, rivers and streams can be simulated using EarthToDate's worldwide elevation map with 0.5–1m vertical accuracy. The simulation raises the water level over the area to show the potential flood footprint; it does not model rainfall runoff or river flow.
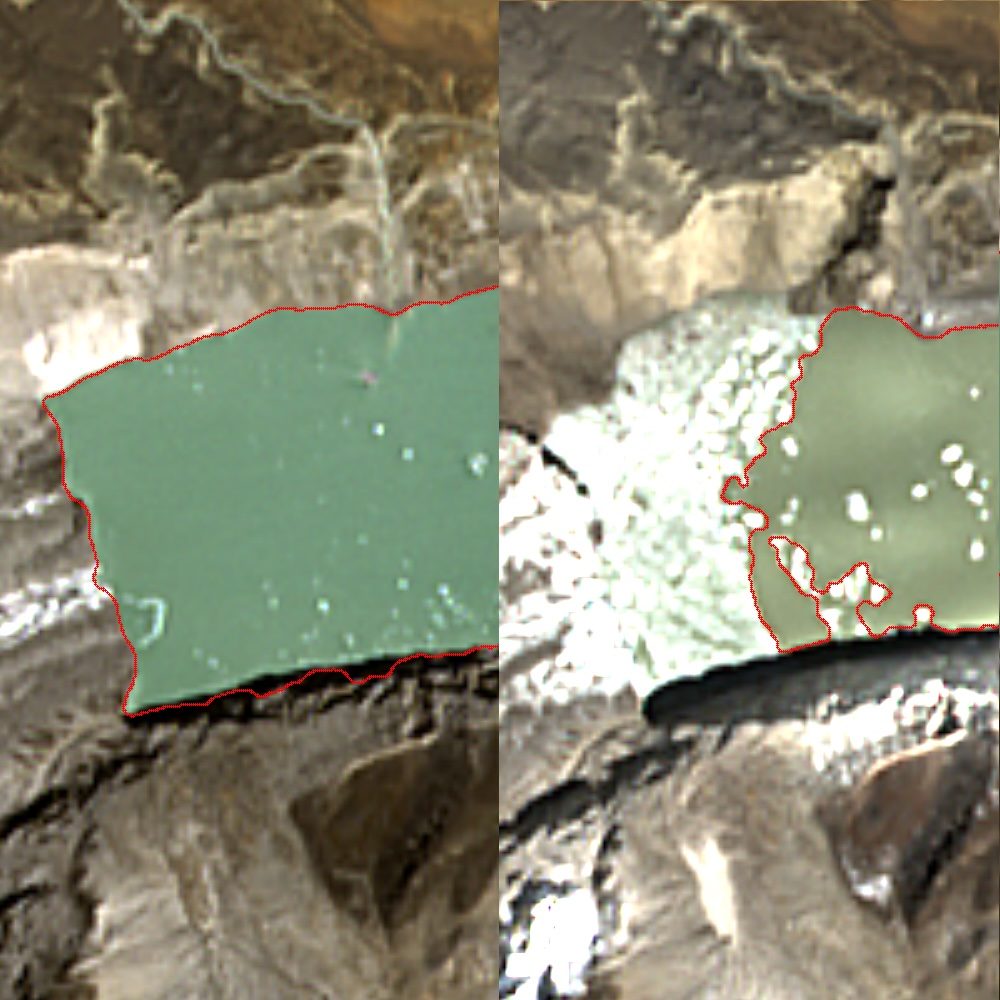
Glacial lake monitoring that estimates the excess water a failing moraine would release and where it would flow, using accurate worldwide elevation data.
Glacial lakes pose an imminent danger to a large number of people and to infrastructure downstream. The Sikkim, India outburst of October 2023 (South Lhonak Lake) and the Rasuwa, Nepal flood of July 2025 are notable recent examples. Worldwide, about 15 million people live within 50km of a glacial lake and 1km of a potential flood path, across more than a thousand glacial lake basins in 30 countries.
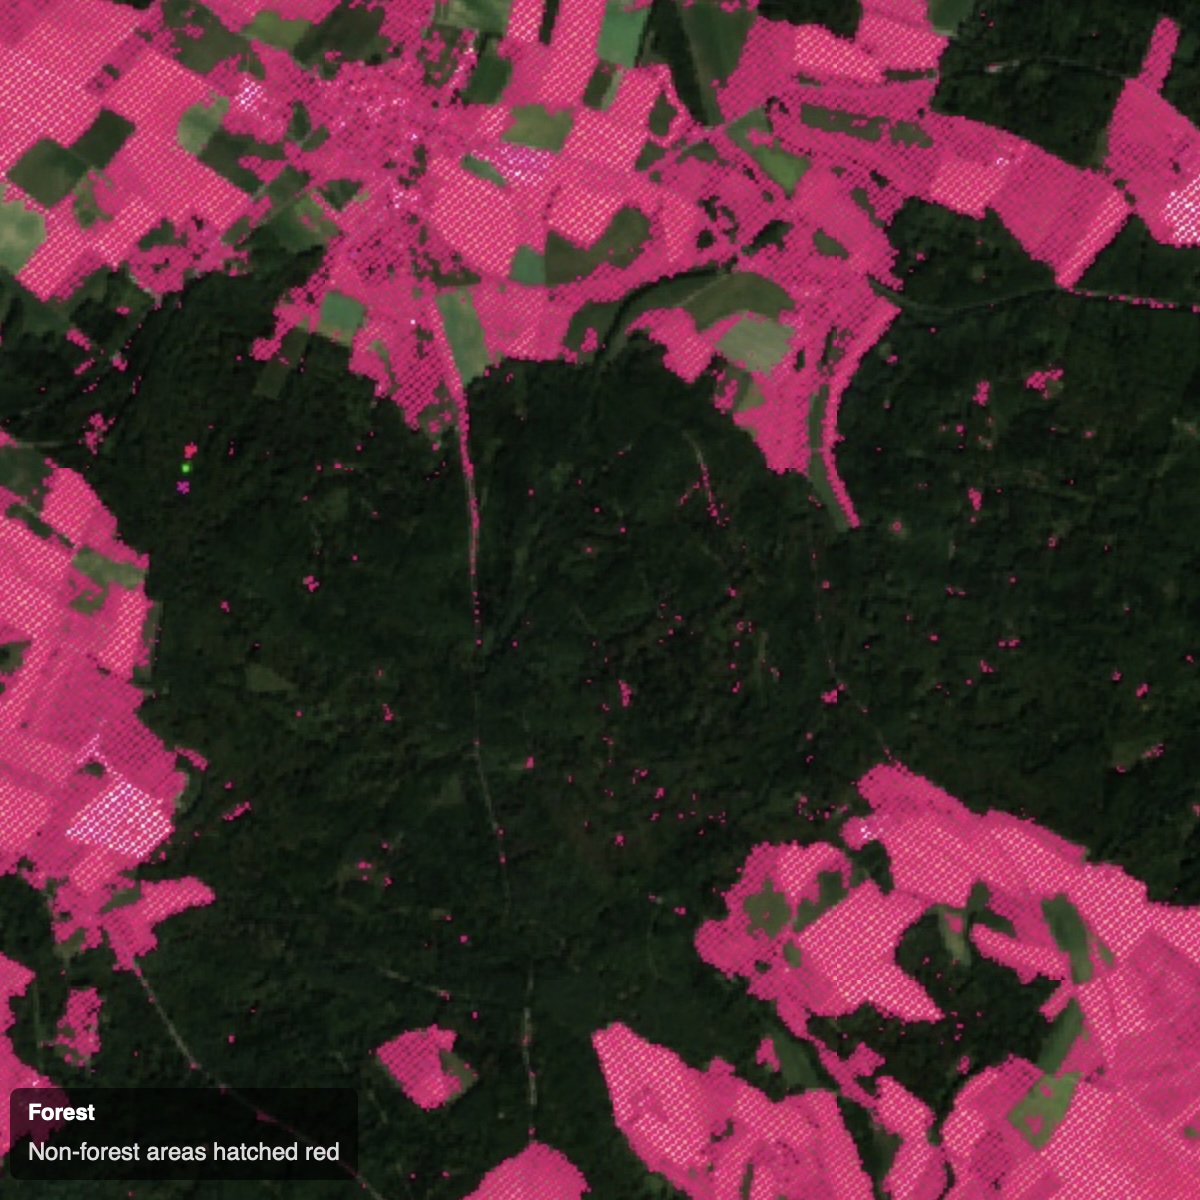
Forest classification, deforestation and reforestation between dates, supporting EUDR proof that products were not grown on land deforested after 2020.
Many players track forests and their change, including government agencies, NGOs, commercial operators, agriculture stakeholders and others. All have similar basic needs:
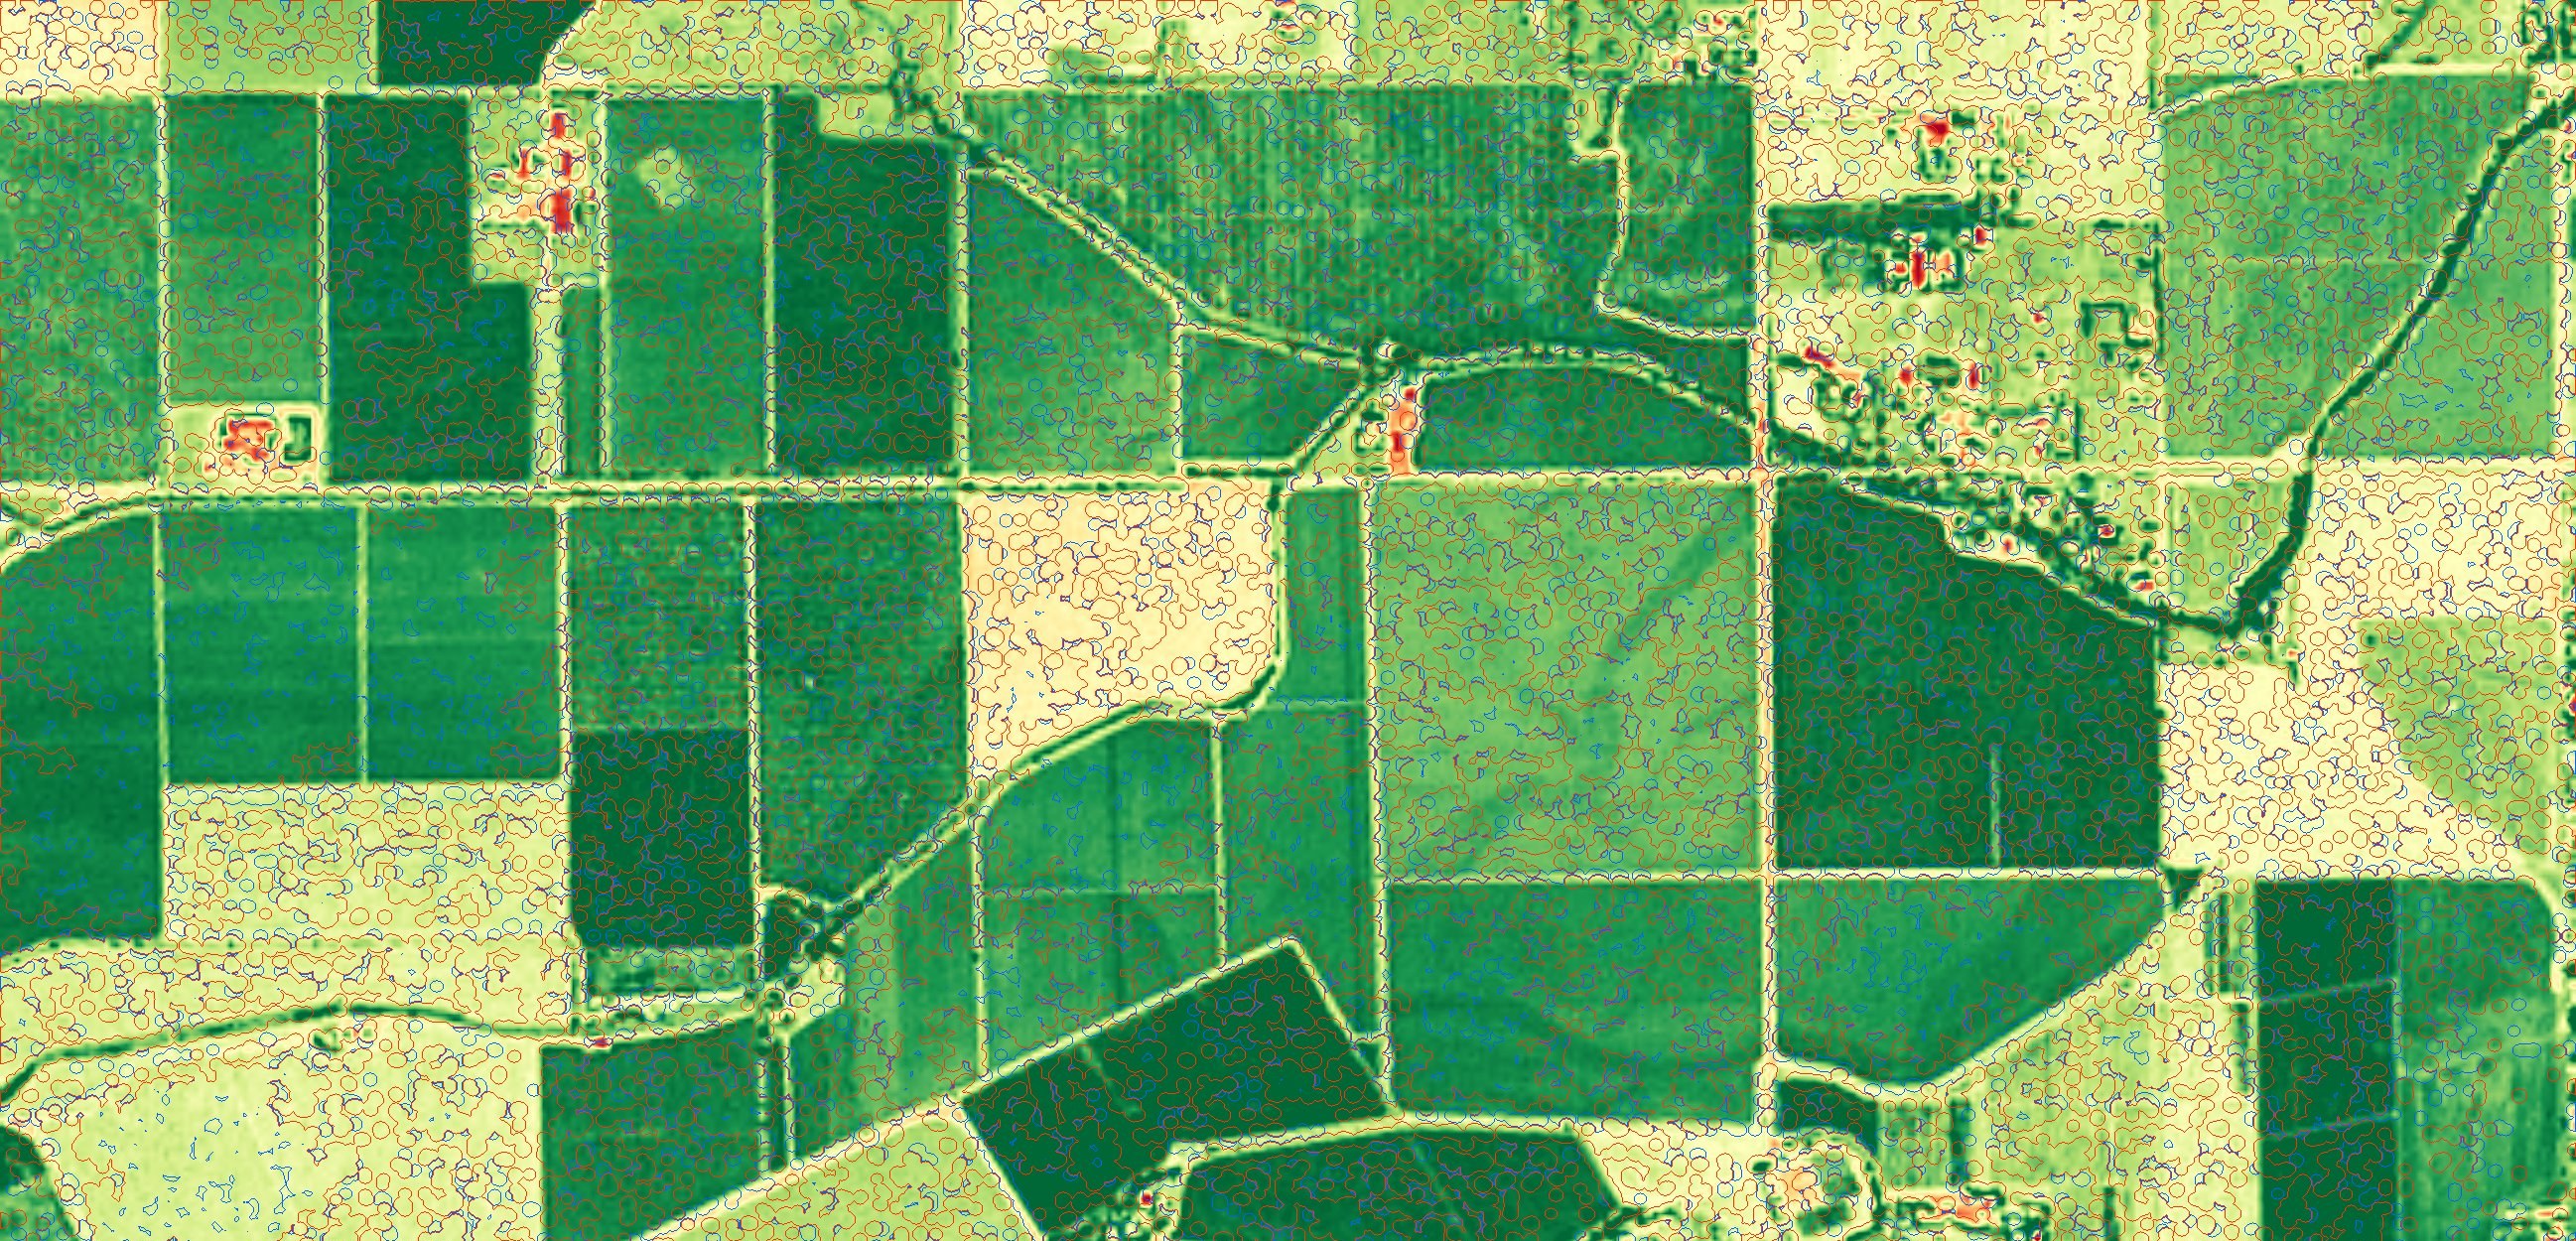
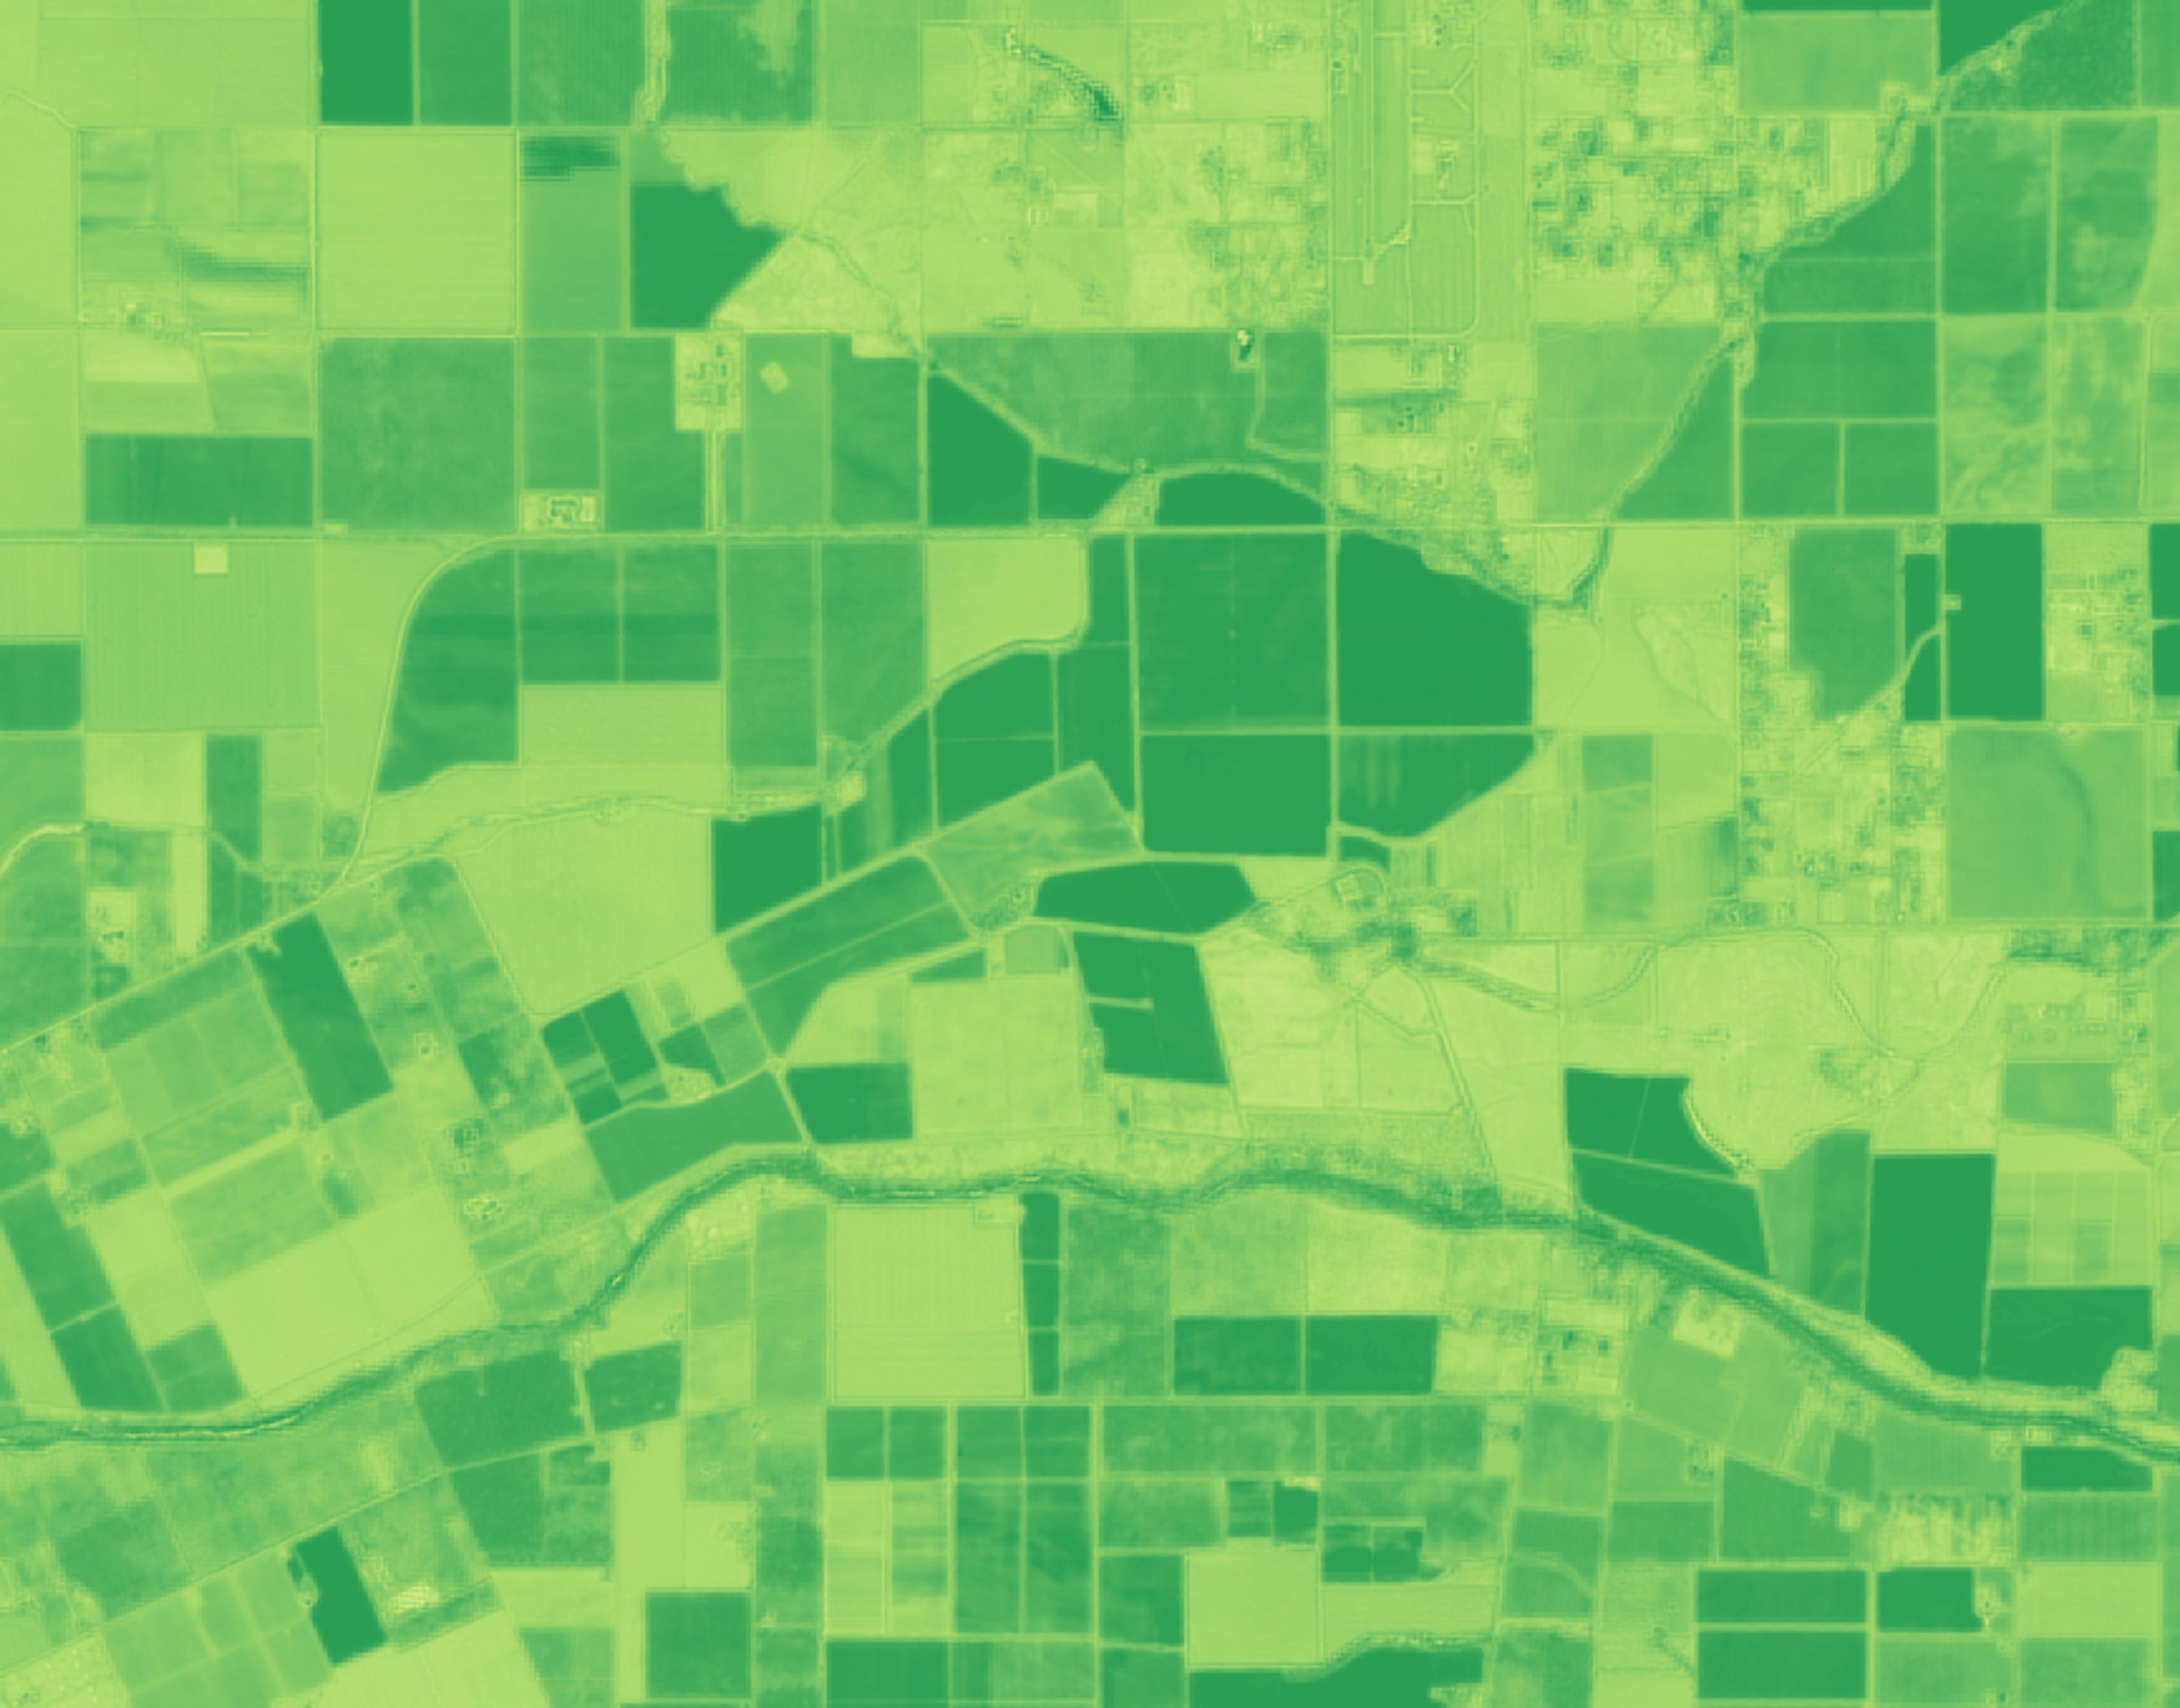
Early detection of field spots developing unexpected higher or lower growth, tracked per field and period.
From government agencies to industrial agriculture growers, all large-scale agriculture operators have one universal need over the growing season — knowing as early as possible where something is potentially an issue in their fields and determining if and how to handle it. Over large areas, often distributed through an even larger region, this becomes a challenge in terms of cost and complexity.
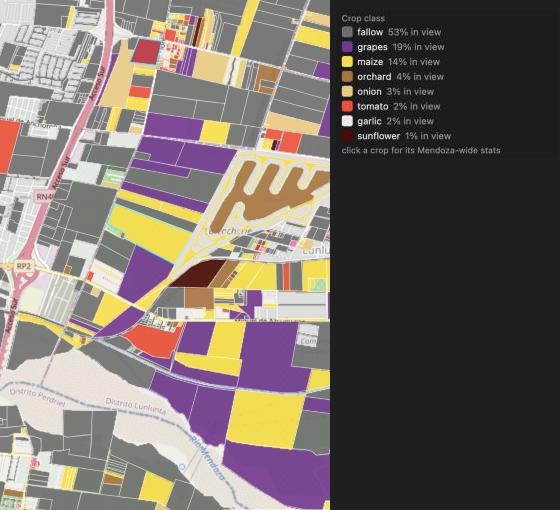
Crop types identified at scale from satellite imagery, as-is anywhere or fine-tuned where past ground truth exists.
Different parties are interested in identifying crop types cultivated, past and especially presently, usually over large areas up to entire countries. About 150 crop species are grown at scale for food and feed, out of some 7,000 plant species ever cultivated, and each comes in many varieties; the best practice at full scale is really self-reporting by growers, if at all, with the resulting delays and inaccuracies.
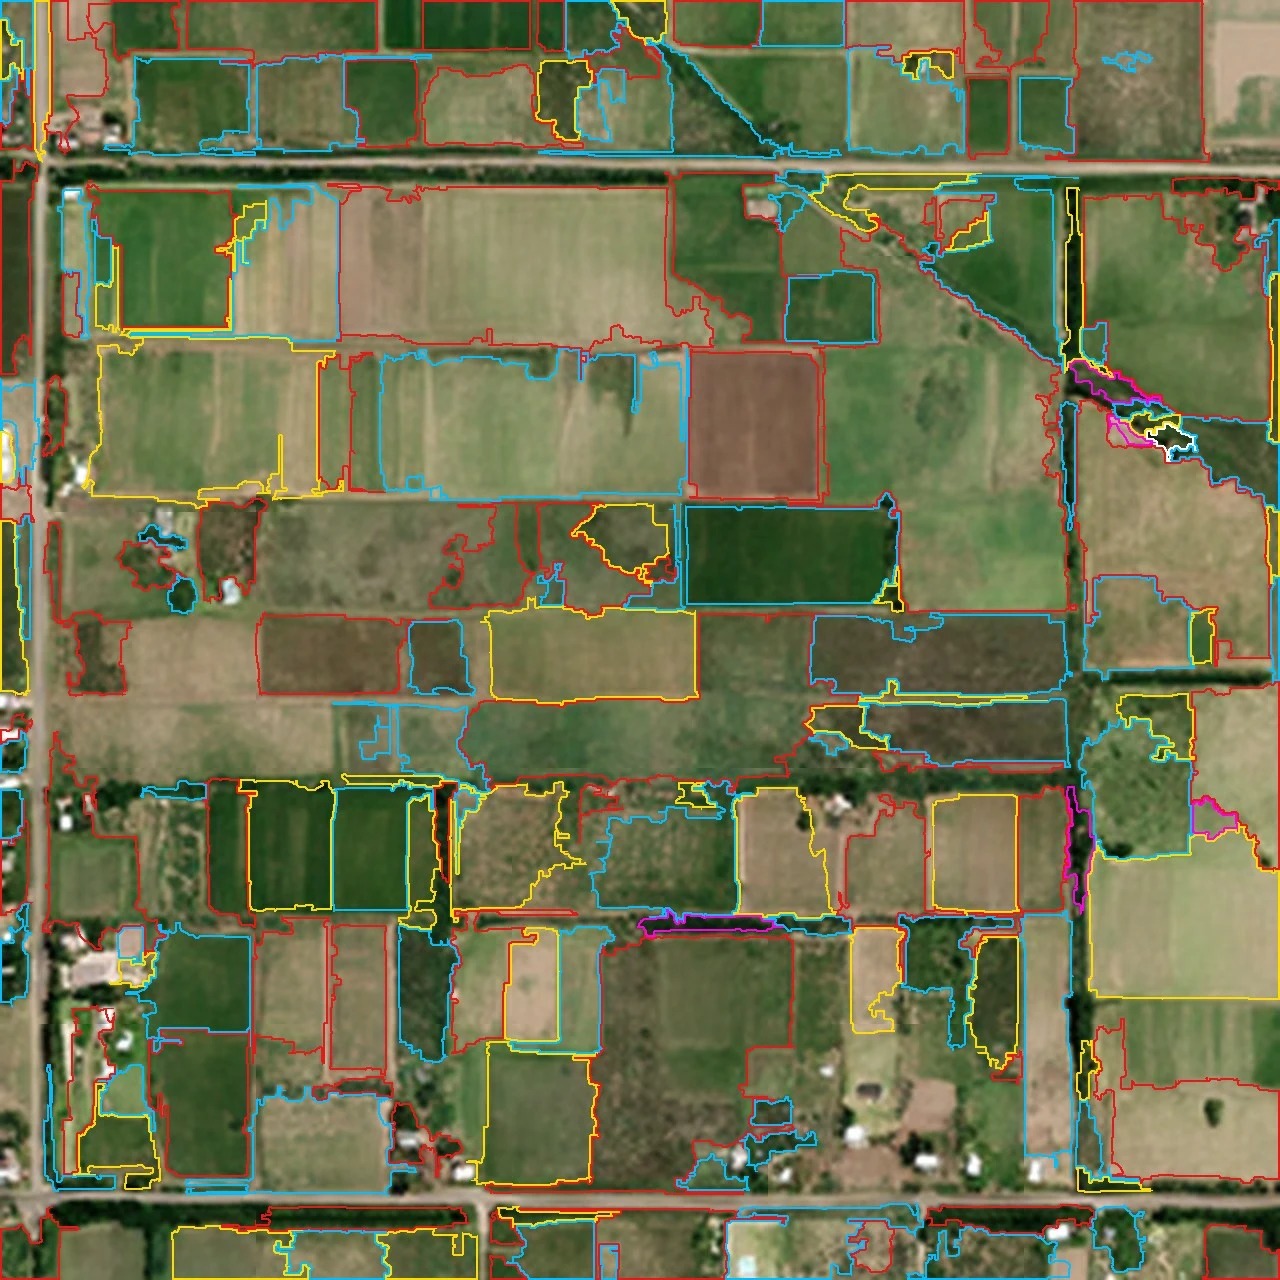
Actual field boundaries on the ground at any given time — the equivalent of expert human inspection.
Field boundaries change often in many situations, with fields divided and merged, part of crop rotation, ownership change and other conditions. With such frequent changes, it is difficult for relevant stakeholders such as government agencies and large-scale commercial operators to track the changes reliably and continuously.
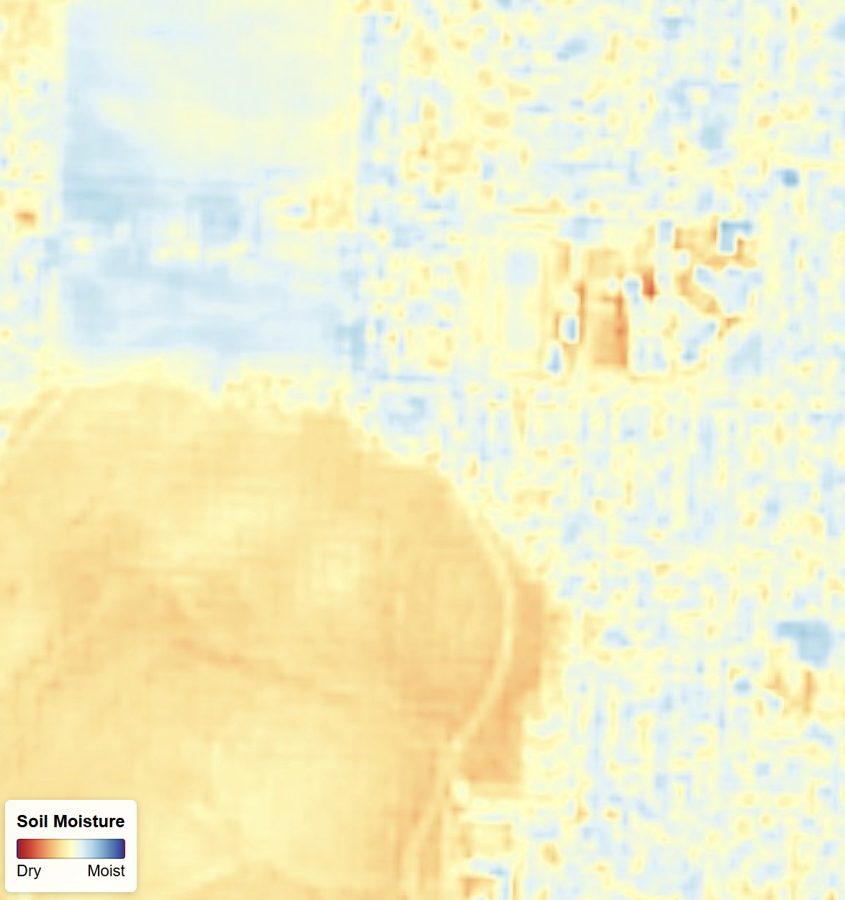
Soil moisture at 2m GSD, integrating multiple accepted methods beyond a single index for reliability across geographies and terrains.
There are many different uses and needs requiring reading soil moisture. Deploying a large number of physical sensors is expensive, complicated, and at some regions and scales impractical. Knowing soil moisture then supports irrigation planning, yield prediction and other valuable needs.
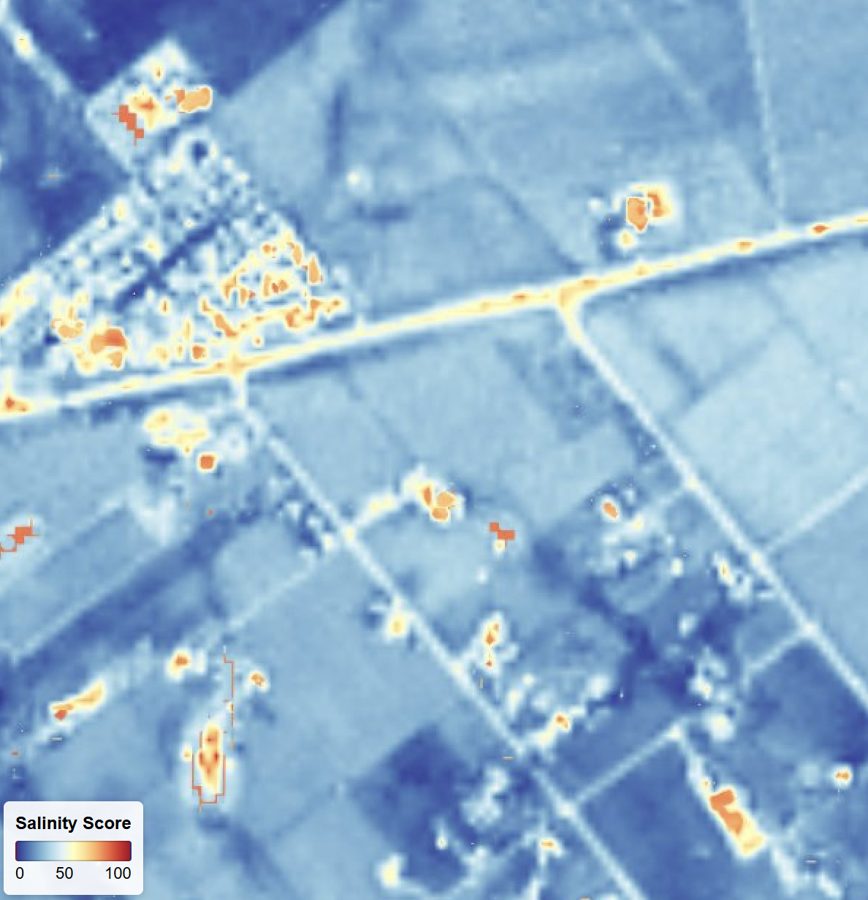
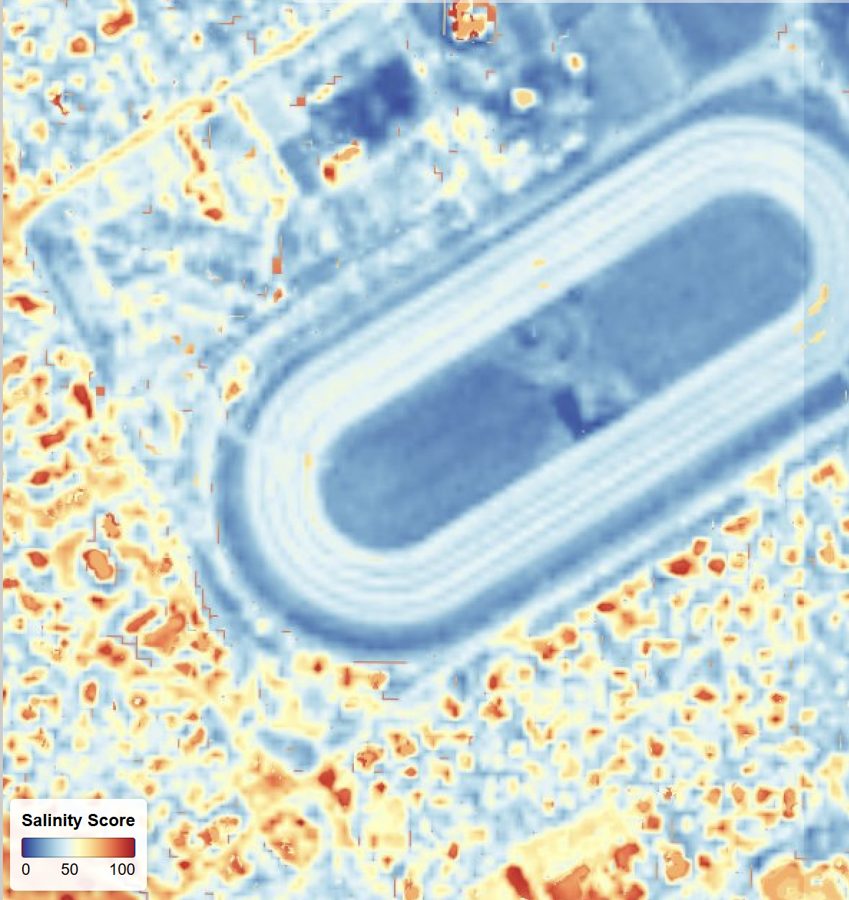
Soil salinity at 2m GSD as a 0–100 score, five classes and a confidence level, for early detection.
Ground salinity is a growing concern in many geographies. It is also more present under specific conditions, such as along irrigation lines. Early detection is obviously crucial, as by the time it can be detected in tens of meters resolution it's likely already catastrophic in nature.
Grassland biomass index at 2m GSD with no local adjustment — reliable relative measurements for grazing decisions.
Grazing animals feeding means a continuous management of determining when potential feeding is being exhausted in one field and the animals need to be moved to another. The question is which one, and the answer is based on parameters such as distance but also, to a large extent, where the animals have more to eat.